Data Interpretation Questions Practice Question and Answer
8 Q:Directions : The expenses of a country for a particular year is given in Pie–Chart. Read the Pie– Chart and answer the questions.
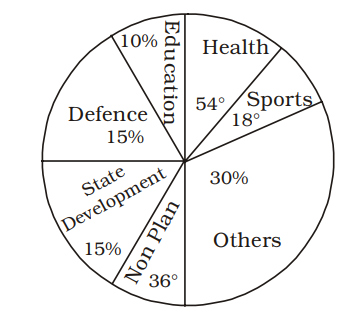
The percent of less money spent on nonplan than that on defense is
1198 063ac34ce612ead74ab54e318
63ac34ce612ead74ab54e318- 115%false
- 25%true
- 312%false
- 410%false
- Show AnswerHide Answer
- Workspace
- SingleChoice
Answer : 2. "5% "
Q:Directions: Study the following table carefully to answer the questions that follow Number of Gold coins (in hundred) produced in Five Different companies during Six Different month.
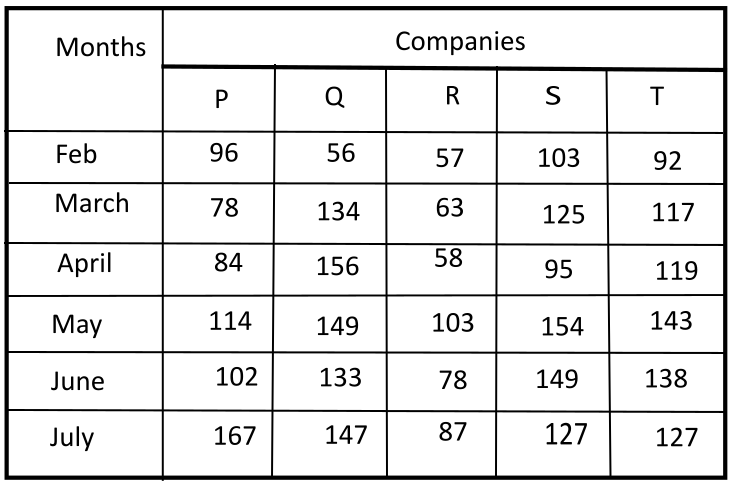
In which Company was the number of Gold coins produced out in the month May highest?
1197 05fd9c85f079b5044b465478a
5fd9c85f079b5044b465478a- 1Qfalse
- 2Pfalse
- 3Tfalse
- 4Strue
- 5Rfalse
- Show AnswerHide Answer
- Workspace
- SingleChoice
Answer : 4. "S "
Q:Directions: A survery of film watching habits of people living in five cities P, Q, R, S and T is summarised below in a table. The coulmn I in the table gives percentage of film-watchers in each city who see only one film a week. The column II gives the total number of film-watchers who see two or more films per week.
Read the table and answer the following questions.
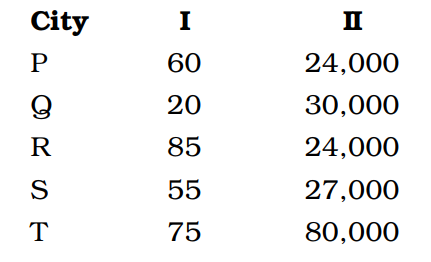
The highest number of film watchers in any given city is :
1196 0632db5fe751e5310a5d10cbd
632db5fe751e5310a5d10cbd- 1Qfalse
- 2Rfalse
- 3Sfalse
- 4Ttrue
- Show AnswerHide Answer
- Workspace
- SingleChoice
Answer : 4. "T "
Q:Direction: Study the given pie chart carefully and answer the following questions accordingly. Given pie chart shows the percentage of players taking part in six different games in an event.
Total number of Players = 1800
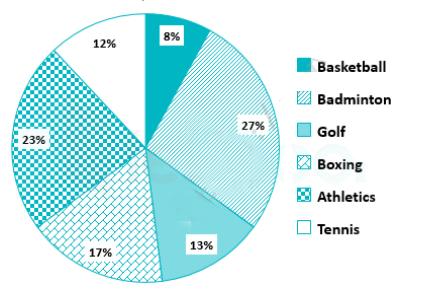
What is the respective ratio of the number of players taking part in Golf and the number of players taking part in Basketball?
1196 064e75e7546497acb22a19437
64e75e7546497acb22a19437- 18 : 13false
- 27 ∶ 13false
- 37 ∶ 26false
- 426 ∶ 7false
- 5None of thesetrue
- Show AnswerHide Answer
- Workspace
- SingleChoice
Answer : 5. "None of these"
Q:Directions : In an Institution there are 800 students. Students use different modes of transport for going to the institution and return. The given pie diagram represents the requisite data. Study the diagram carefully and answer the questions.

The number of students who travel in public bus is
1194 063ac32e2fb04114b2d3cea1a
63ac32e2fb04114b2d3cea1a- 1150false
- 2120true
- 3130false
- 4125false
- Show AnswerHide Answer
- Workspace
- SingleChoice
Answer : 2. "120"
Q:Table below shows the number of candidates appearing for the interview and the percentage of candidates found eligible for the post in various companies (A, B, C, D, E, F).
Study the Tables and give answer the following Questions.
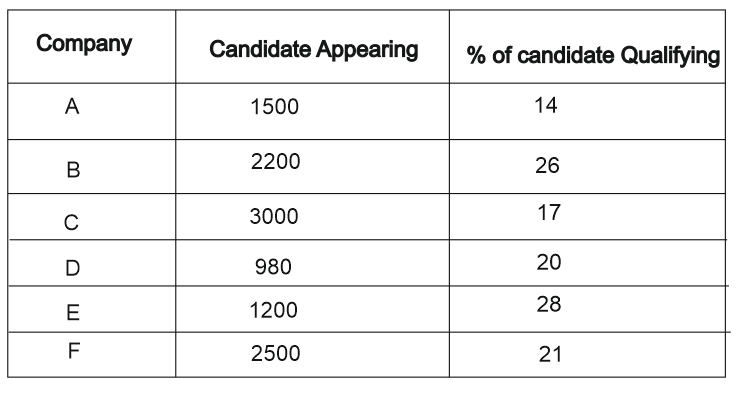
Which company has the lowest number of candidates appearing in the interview?
1192 05f1e750126299776aa40b0bb
5f1e750126299776aa40b0bbStudy the Tables and give answer the following Questions.
- 1Efalse
- 2Dtrue
- 3Cfalse
- 4Afalse
- Show AnswerHide Answer
- Workspace
- SingleChoice
Answer : 2. "D"
Q:Directions : The pie graph indicates the break-up of the cost of construction of a house. Assuming that the total cost of construction is Rs 6,00,000, answer the following questions.
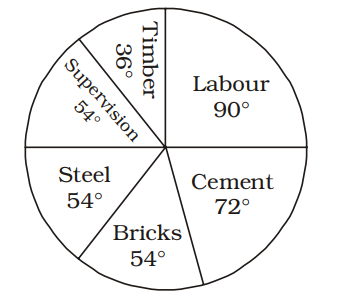
The amount spent on timber is :
1190 063aac275afa10611461ed9ea
63aac275afa10611461ed9ea
- 1₹ 60,000true
- 2₹ 2,00,000false
- 3₹ 30,000false
- 4₹ 50,000false
- Show AnswerHide Answer
- Workspace
- SingleChoice
Answer : 1. "₹ 60,000 "
Q: The table below shows the number of overs bowled and the number of wickets taken by five bowlers in a match
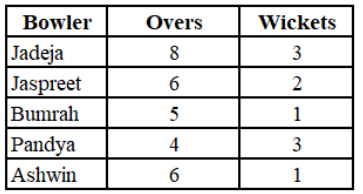
If in each over every bowler bowled 6 balls, in that match which bowler had bowled the highest number of balls per wicket taken by hin1?
1189 0642ac34f08ca2357ae78da0b
642ac34f08ca2357ae78da0b- 1Jadejafalse
- 2Bumrahfalse
- 3Ashwintrue
- 4Jaspreetfalse
- Show AnswerHide Answer
- Workspace
- SingleChoice