Data Interpretation Questions Practice Question and Answer
8 Q:Table below shows the number of candidates appearing for the interview and the percentage of candidates found eligible for the post in various companies (A, B, C, D, E, F).
Study the Tables and give answer the following Questions.
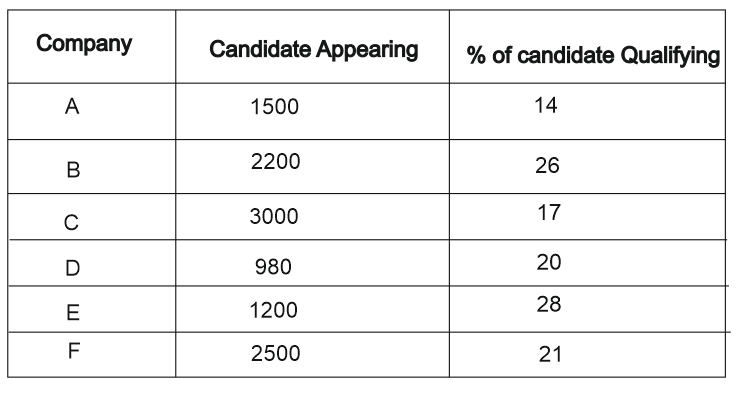
How many qualified candidates are there in Company F?
1109 05f1e75591b4d8003eeb07229
5f1e75591b4d8003eeb07229Study the Tables and give answer the following Questions.
- 1525true
- 2520false
- 3530false
- 4540false
- Show AnswerHide Answer
- Workspace
- SingleChoice
Answer : 1. "525"
Q:Directions: Study the following table carefully to answer the questions that follow Number of Gold coins (in hundred) produced in Five Different companies during Six Different month.
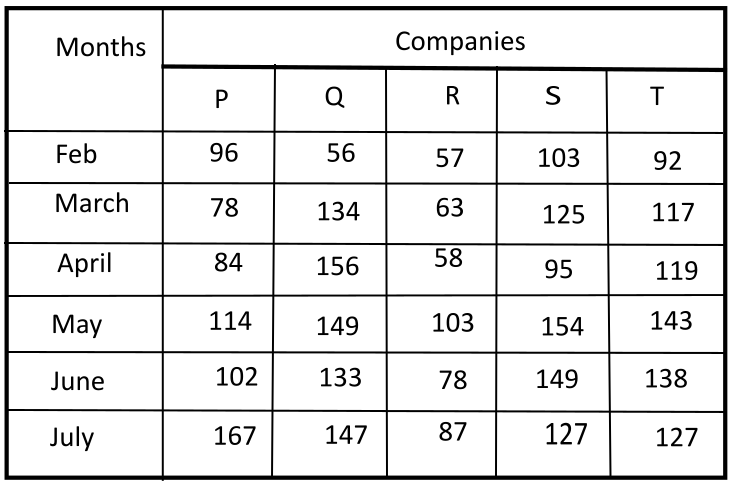
Number of Gold coins produced from company R in the month May was approximately what percentage of the number of Gold coins produced in the company T in the month March?
1108 05fd9c8b389d4575ab490d7db
5fd9c8b389d4575ab490d7db- 185true
- 295false
- 360false
- 440false
- 575false
- Show AnswerHide Answer
- Workspace
- SingleChoice
Answer : 1. "85 "
Q:The pie graph given here shows the break-up of the cost of construction of a house.
Assuming that the total cost of construction is ₹ 6,00,000, answer the questions.
Break-up of the cost of construction of a house
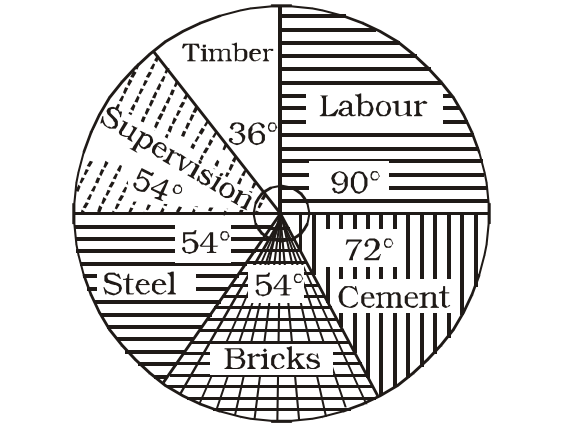
The amount spent on labour exceeds the amount spent on steel by
1107 06331968a31300b7ce48a8eba
6331968a31300b7ce48a8eba- 15 per cent of the total cost.false
- 210 per cent of the total cost.true
- 312 per cent of the total cost.false
- 415 per cent of the total cost.false
- Show AnswerHide Answer
- Workspace
- SingleChoice
Answer : 2. "10 per cent of the total cost. "
Q:Directions: A survery of film watching habits of people living in five cities P, Q, R, S and T is summarised below in a table. The coulmn I in the table gives percentage of film-watchers in each city who see only one film a week. The column II gives the total number of film-watchers who see two or more films per week.
Read the table and answer the following questions.
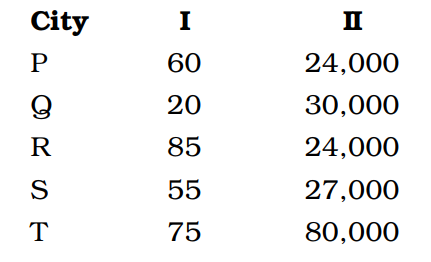
The total number of all film-watchers in the five cities who see only one film in a week is
1106 0632db63e5c208a6bf7f2775c
632db63e5c208a6bf7f2775c- 1113000false
- 2425200false
- 3452500true
- 4500000false
- Show AnswerHide Answer
- Workspace
- SingleChoice
Answer : 3. "452500 "
Q:Direction: Study the given pie chart carefully and answer the following questions accordingly. Given pie chart shows the percentage of players taking part in six different games in an event.
Total number of Players = 1800
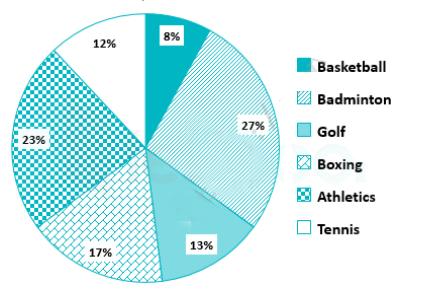
What is the respective ratio of the number of players taking part in Golf and the number of players taking part in Basketball?
1105 064e75e7546497acb22a19437
64e75e7546497acb22a19437- 18 : 13false
- 27 ∶ 13false
- 37 ∶ 26false
- 426 ∶ 7false
- 5None of thesetrue
- Show AnswerHide Answer
- Workspace
- SingleChoice
Answer : 5. "None of these"
Q:Directions :- Refer the graph and answer the given questions.
The following line graph shows the number of products sold by company A and B during six years.
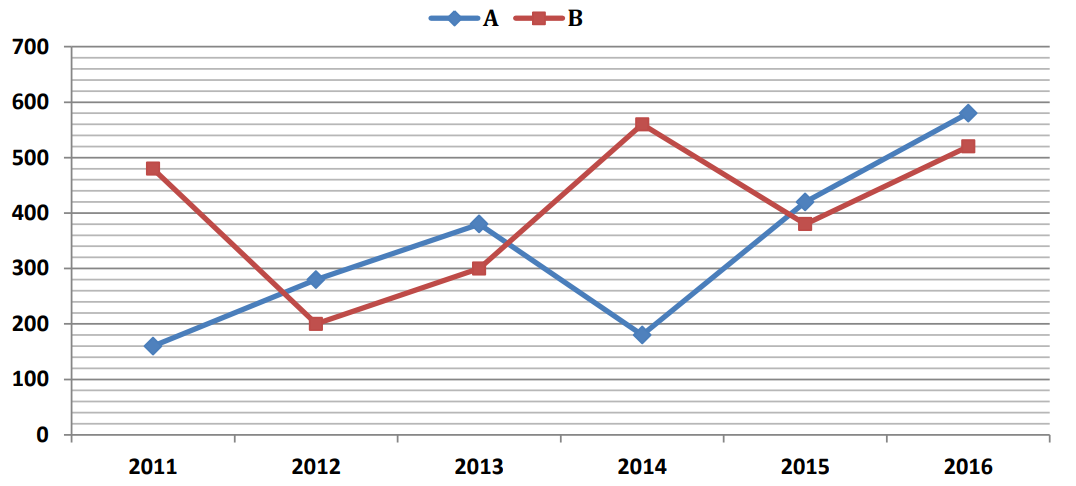
Out of the total number of products sold by A and B together in 2011, only 20% are defected. What is the total number of defected products sold by A and B together in 2011?
1105 05fd32e77956cb668fbdd9206
5fd32e77956cb668fbdd9206The following line graph shows the number of products sold by company A and B during six years.
- 1228false
- 2128true
- 3160false
- 4148false
- 5138false
- Show AnswerHide Answer
- Workspace
- SingleChoice
Answer : 2. "128"
Q: The table below shows the number of cakes sold by six different bakeries in a town on five different days of particular week.
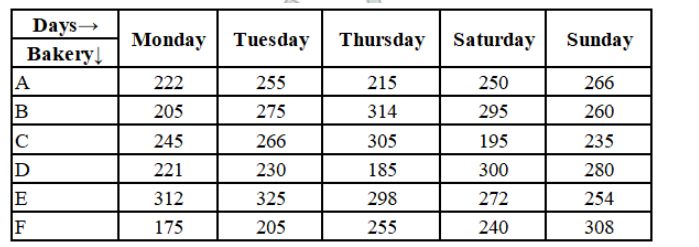
What is the total number of cakes sold by the bakery D on Monday, Thursday and Sunday, taken together?
1103 064476d15e2eff56868889593
64476d15e2eff56868889593- 1779false
- 2668false
- 3530false
- 4686true
- Show AnswerHide Answer
- Workspace
- SingleChoice
Answer : 4. "686"
Q:Directions : The pie graph indicates the break-up of the cost of construction of a house. Assuming that the total cost of construction is Rs 6,00,000, answer the following questions.
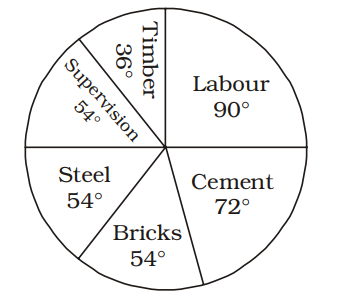
The amount spent on timber is :
1101 063aac275afa10611461ed9ea
63aac275afa10611461ed9ea
- 1₹ 60,000true
- 2₹ 2,00,000false
- 3₹ 30,000false
- 4₹ 50,000false
- Show AnswerHide Answer
- Workspace
- SingleChoice