Data Interpretation Questions Practice Question and Answer
8 Q:Direction: The given Bar Graph Presents the number of different types of vehicles (in lakhs) exported by a company during 2014 and 2015.
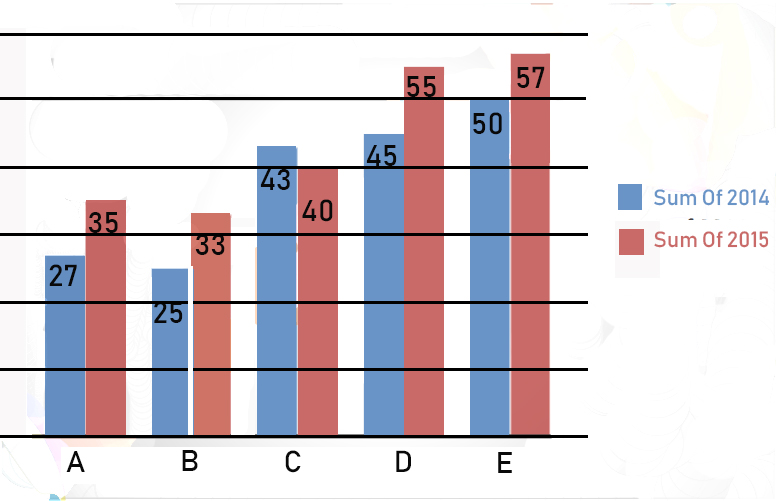
What is the ratio of the total number of type A and c vehicles exported in 2014 to the total number of type B and E vehicles exported in 2015?
1095 0602512d5473e977f3667d301
602512d5473e977f3667d301- 12:3false
- 25:7false
- 38:11false
- 47:9true
- Show AnswerHide Answer
- Workspace
- SingleChoice
Answer : 4. "7:9 "
Q:In the following diagram, three different products (in thousands) produced by a company in 5 years are given and after studying them carefully, answer the following questions.
Three products produced by a company in different years (in thousands)
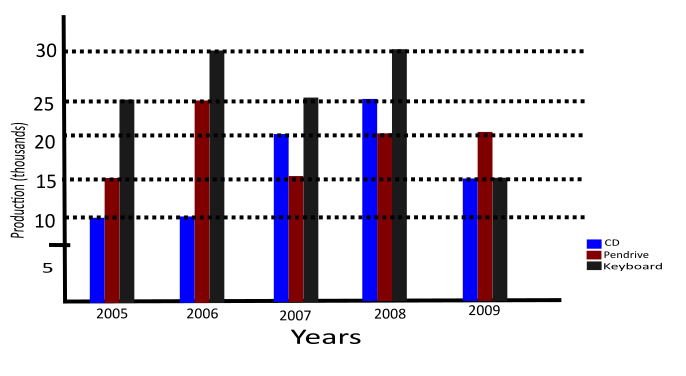
What is the difference between the CD produced between the year 2007 and the year 2009?
1095 05faa5dc15ebf3a64427b0eaa
5faa5dc15ebf3a64427b0eaa- 120,000false
- 215,000true
- 35,000false
- 4500false
- Show AnswerHide Answer
- Workspace
- SingleChoice
Answer : 2. "15,000"
Q:Directions : The pie graph indicates the break-up of the cost of construction of a house. Assuming that the total cost of construction is Rs 6,00,000, answer the following questions.
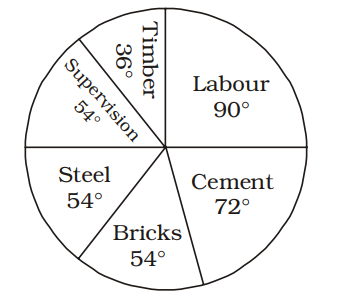
The percentage of the total cost of construction spent on cement, steel and supervision is :
1090 063aac4d45770eb565d513939
63aac4d45770eb565d513939
- 150%true
- 255%false
- 360%false
- 465%false
- Show AnswerHide Answer
- Workspace
- SingleChoice
Answer : 1. "50%"
Q:Directions : The Bar Graph given here shows the population (in crores) of India in various census years. Observe the graph and answer the question based on it.
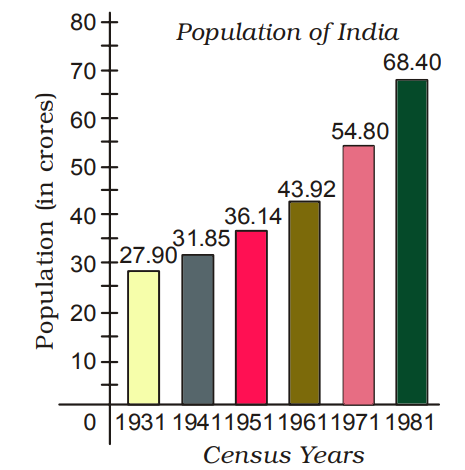
Peryear increase in population from the year 1931 to 1981 is
1090 06453aa5613eb5908ae357970
6453aa5613eb5908ae357970- 18100000true
- 27600000false
- 38900000false
- 46700000false
- Show AnswerHide Answer
- Workspace
- SingleChoice
Answer : 1. "8100000 "
Q: The table below shows the number of overs bowled and the number of wickets taken by five bowlers in a match
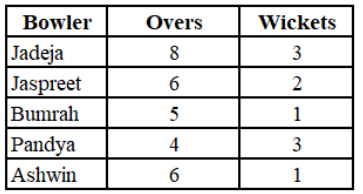
If in each over every bowler bowled 6 balls, in that match which bowler had bowled the highest number of balls per wicket taken by hin1?
1086 0642ac34f08ca2357ae78da0b
642ac34f08ca2357ae78da0b- 1Jadejafalse
- 2Bumrahfalse
- 3Ashwintrue
- 4Jaspreetfalse
- Show AnswerHide Answer
- Workspace
- SingleChoice
Answer : 3. "Ashwin "
Q:Directions: Read the pie chart carefully and answer the following questions.
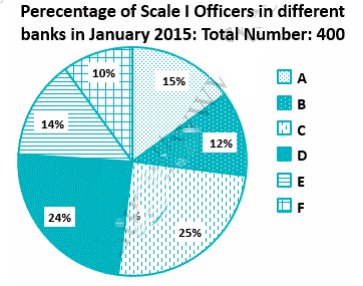
Note: No new employees joined the given banks of left the given banks from January 2015 to December 2015.
In January 2016, some Scale I Officers resigned from Bank C and all of them joined Bank B. If the resultant respective ratio between the number of Scale I Officers in Bank C and that in Bank B is 24 : 13, what is the number of Scale I Officers who resigned from Bank C?
1084 064f1e0103be218b6cde4ef0a
64f1e0103be218b6cde4ef0a- 13false
- 26false
- 37false
- 44true
- 55false
- Show AnswerHide Answer
- Workspace
- SingleChoice
Answer : 4. "4"
Q: The following table shows the number of laptops sold from five different stores in a city on five days of a given week.
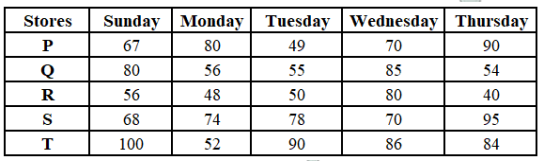
What is the ratio of the total number of computers sold from store S on Tuesday, Monday and Sunday taken together to that sold from store P on Tuesday, Wednesday and Thursday taken together?
1082 0642824fcdcb650c14572115f
642824fcdcb650c14572115f- 113 : 11false
- 211 : 15false
- 311 : 19false
- 420 : 19true
- Show AnswerHide Answer
- Workspace
- SingleChoice
Answer : 4. "20 : 19"
Q: The following pie chart shows the number of bags sold by 7 different shops during a month as percentages of the total number of bags sold during this month by these 7 shops taken together.

If the total number of bags sold during the given month by these 7 shops taken together was 1400, then what was the total number of bags sold by S3 and S 7 taken together?
1081 0642ac3aded76c064b863b95b
642ac3aded76c064b863b95b- 1240false
- 2196false
- 3224true
- 4210false
- Show AnswerHide Answer
- Workspace
- SingleChoice