Data Interpretation Questions Practice Question and Answer
8 Q:Directions: Study the following table carefully to answer the questions that follow Number of Gold coins (in hundred) produced in Five Different companies during Six Different month.
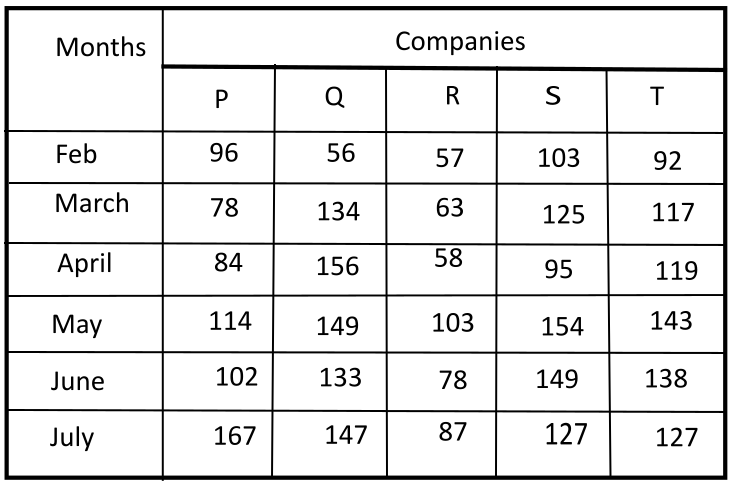
In which company the number of the Gold coins continuously increased during the year February to July?
1078 05fd9c802ee21a5440627e524
5fd9c802ee21a5440627e524- 1Only R and Tfalse
- 2Only Qfalse
- 3Only Pfalse
- 4Only Q and Tfalse
- 5None of thesetrue
- Show AnswerHide Answer
- Workspace
- SingleChoice
Answer : 5. "None of these"
Q:Directions : Read the graph and answer the following questions.
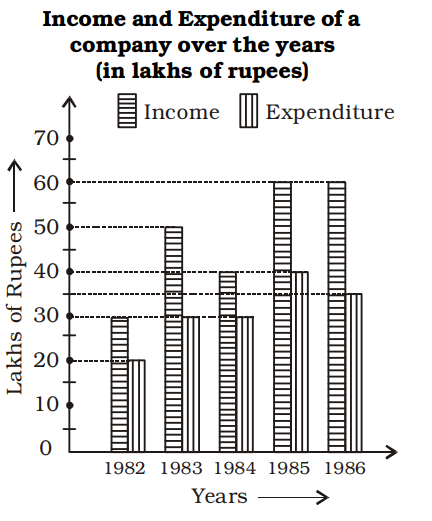
The total income exceeds the total expenditure over the years 1982 to 1986 by
1077 0646104f7c899b466f4459b72
646104f7c899b466f4459b72- 185 lakhstrue
- 2105 lakhsfalse
- 3115 lakhsfalse
- 4120 lakhsfalse
- Show AnswerHide Answer
- Workspace
- SingleChoice
Answer : 1. "85 lakhs "
Q:In the following diagram, three different products (in thousands) produced by a company in 5 years are given and after studying them carefully, answer the following questions.
Three products produced by a company in different years (in thousands)
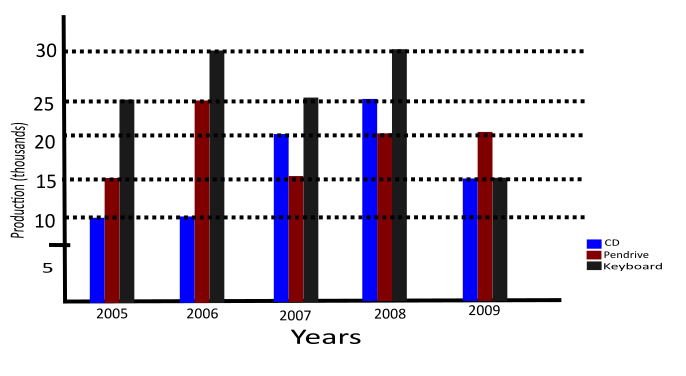
What will be the average of the Key board produced in the year 2006 and year 2008?
1070 05faa5e20086f7f6870549c78
5faa5e20086f7f6870549c78- 130,000true
- 235,000false
- 360,000false
- 450,000false
- Show AnswerHide Answer
- Workspace
- SingleChoice
Answer : 1. "30,000"
Q:Study the graphs to answer these questions.
The pie chart shows the percentage of graduate employees in various department of M/S XYZ limited.
The employees in various departments of M/S. XYZ limited. Other than graduate employees are those employees who are either post graduate or undergraduates.

What is the median of number of graduate employees in Production, Marketing, Planning and Finance departments?
1068 06011442daf82aa3010a2ef35
6011442daf82aa3010a2ef35The pie chart shows the percentage of graduate employees in various department of M/S XYZ limited.
The employees in various departments of M/S. XYZ limited. Other than graduate employees are those employees who are either post graduate or undergraduates.
- 1800false
- 2675true
- 311000false
- 4None of thesefalse
- Show AnswerHide Answer
- Workspace
- SingleChoice
Answer : 2. "675 "
Q:Direction: Study the following information to answer the questions.
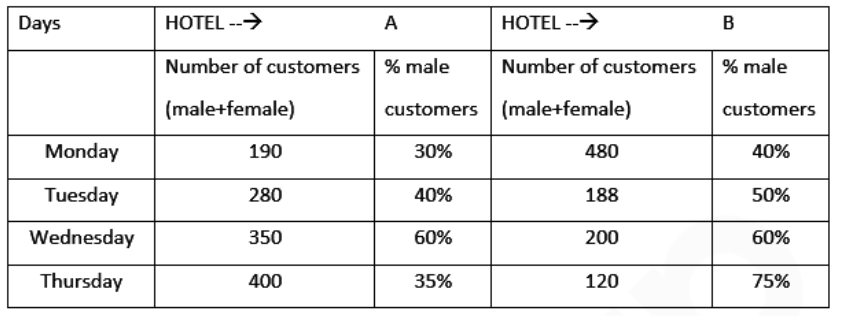
In hotel A, what is the difference between the total number of male customers on Monday and Tuesday together and that on Wednesday and Thursday together?
1047 0609d1bc3b9384d208ce0c847
609d1bc3b9384d208ce0c847- 1187false
- 2181true
- 3183false
- 4177false
- 5185false
- Show AnswerHide Answer
- Workspace
- SingleChoice
Answer : 2. "181"
Q:Directions: Given bar graph shows the number of plain books and lined books (in hundreds) available at three different stores and the table shows the percentage of total books (Plain + lined) that was sold by different stores.
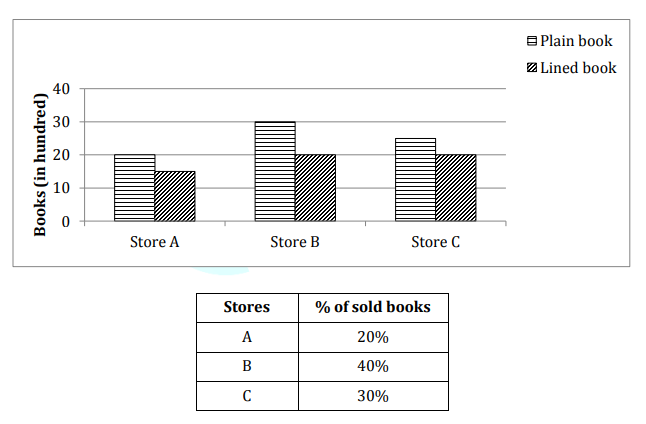
The average of total books sold by stores B and C together is how much more than the total unsold books of store A.
1045 064d5d6cda7983774472605e9
64d5d6cda7983774472605e9- 11125true
- 21075false
- 31055false
- 41175false
- 51225false
- Show AnswerHide Answer
- Workspace
- SingleChoice
Answer : 1. "1125"
Q:In the following diagram, three different products (in thousands) produced by a company in 5 years are given and after studying them carefully, answer the following questions.
Three products produced by a company in different years (in thousands)
What is the average number of pan-drives produced by the company in all the years?
1043 05faa5d67ece37f513633591b
5faa5d67ece37f513633591b- 132,000false
- 221,000true
- 334,000false
- 410,500false
- Show AnswerHide Answer
- Workspace
- SingleChoice
Answer : 2. "21,000"
Q:Directions: Answer the questions based on the information given below:
The following line graph shows revenue and expenditure of company A for 5 years (in Lakhs):
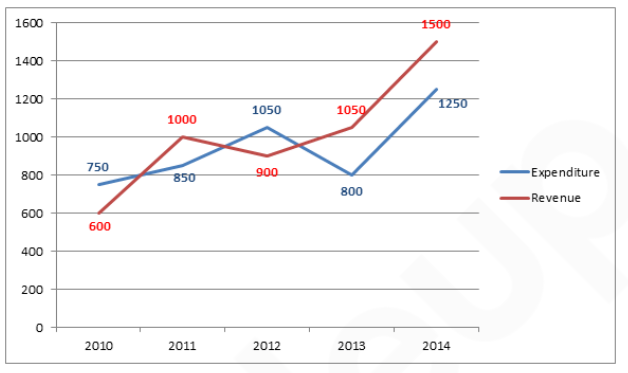
What is the ratio of sum of expenditure in the year 2012 and 2013 to that of revenue in year 2014?
1041 060a4dfcdb1d2440614c00dcb
60a4dfcdb1d2440614c00dcbThe following line graph shows revenue and expenditure of company A for 5 years (in Lakhs):
- 130: 37false
- 237: 30true
- 321: 25false
- 425: 21false
- 5None of thesefalse
- Show AnswerHide Answer
- Workspace
- SingleChoice