Data Interpretation Questions Practice Question and Answer
8 Q:Direction: Read the following graph carefully and answer the following questions:
The following bar graph shows the quantity(in kg) of wheat, rice, pulses and salts sold by two companies P and Q in the month of January.
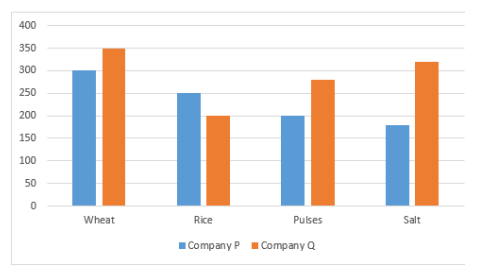
What is the difference between the quantity of Rice and Salts sold by company Q and the quantity of Pulses and Salts sold by company P?
1040 064ddf3e12e3b664a0a466750
64ddf3e12e3b664a0a466750The following bar graph shows the quantity(in kg) of wheat, rice, pulses and salts sold by two companies P and Q in the month of January.
- 1140 kgtrue
- 2180 kgfalse
- 3240 kgfalse
- 4210 kgfalse
- 5200 kgfalse
- Show AnswerHide Answer
- Workspace
- SingleChoice
Answer : 1. "140 kg"
Q:Direction: Read the following table carefully and answer the following questions:
Table shows the percentage of male and female employees in different education in a company and total number of males and females:
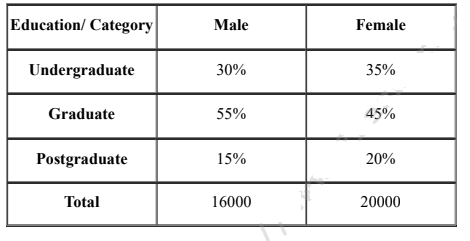
Find the postgraduate employees of a company are approximately what percent of total employees of a company?
1038 064e7516813f72deddceb0e95
64e7516813f72deddceb0e95- 112%false
- 222%false
- 315%false
- 426%false
- 518%true
- Show AnswerHide Answer
- Workspace
- SingleChoice
Answer : 5. "18%"
Q:Directions: Study the Bar diagram carefully and answer the questions.
The Bar diagram shows the trends of foreign direct investment (FDI) into India from all over the World (in Rs. crores).
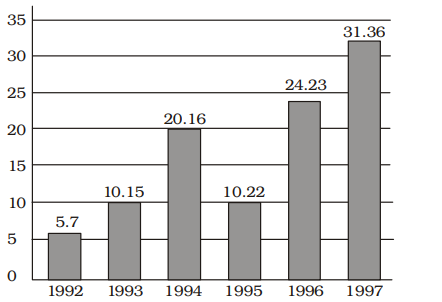
The absolute difference in FDI to India between 1996 and 1997 is
1034 063a56b4a8fc9692134068f38
63a56b4a8fc9692134068f38 - 1Rs. 7.29 croresfalse
- 2Rs. 7.13 crorestrue
- 3Rs. 7.16 croresfalse
- 4Rs. 7.22 croresfalse
- Show AnswerHide Answer
- Workspace
- SingleChoice
Answer : 2. "Rs. 7.13 crores "
Q:Direction: Read the following table carefully and answer the following questions:
Table shows the percentage of male and female employees in different education in a company and total number of males and females:
The difference between Graduate female and male employees in the company.
1034 064e752a0de1aa1b70fdeed48
64e752a0de1aa1b70fdeed48- 1150false
- 2100false
- 3200true
- 4250false
- 5180false
- Show AnswerHide Answer
- Workspace
- SingleChoice
Answer : 3. "200"
Q:Direction: Read the following table carefully and answer the following questions:
Table shows the percentage of male and female employees in different education in a company and total number of males and females:
Find the number of Undergraduate male employees is approximately what percent less than the number of undergraduate female employees?
1034 064e7524cd928d8b716136a79
64e7524cd928d8b716136a79- 131%true
- 221%false
- 327%false
- 424%false
- 534%false
- Show AnswerHide Answer
- Workspace
- SingleChoice
Answer : 1. "31%"
Q:Direction: Study the following line graph carefully and answer the questions given below.
In the below line graph, the number of animals in two zoo A and B in the years – 2001, 2003, 2005 and 2007 is given.
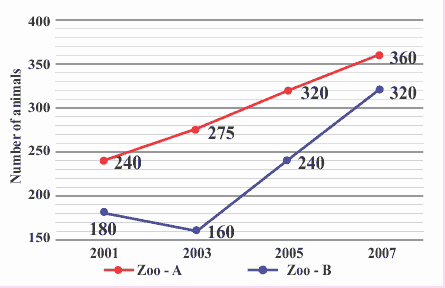
What is the ratio of the number of animals in zoo-A in the years 2001 and 2005 together and the number of animals in zoo-B in the years 2003 and 2007 together?
1032 064e5d9e2640c09b72f94cfb5
64e5d9e2640c09b72f94cfb5In the below line graph, the number of animals in two zoo A and B in the years – 2001, 2003, 2005 and 2007 is given.
- 17: 6true
- 26: 7false
- 35: 6false
- 47: 5false
- 5None of thesefalse
- Show AnswerHide Answer
- Workspace
- SingleChoice
Answer : 1. "7: 6"
Q:Directions: Answer the questions based on the information given below:
The following line graph shows revenue and expenditure of company A for 5 years (in Lakhs):
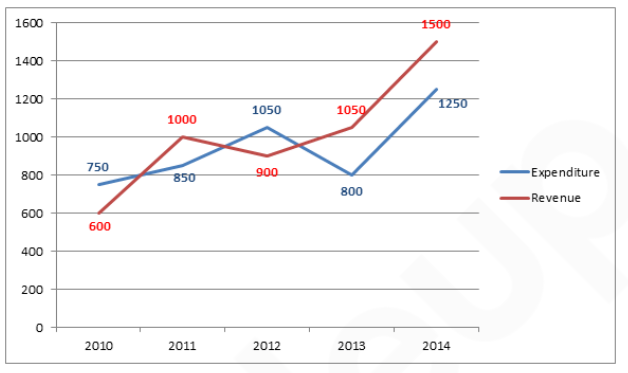
What is the average expenditure of the company A over the years?
1031 060a4df38f98a59772519fd74
60a4df38f98a59772519fd74The following line graph shows revenue and expenditure of company A for 5 years (in Lakhs):
- 11000 lakhsfalse
- 21010 lakhsfalse
- 3940 lakhstrue
- 4900 lakhsfalse
- 5None of thesefalse
- Show AnswerHide Answer
- Workspace
- SingleChoice
Answer : 3. "940 lakhs "
Q:Directions : Study the following pie chart carefully and answer the questions. The pie chart represents the percentage of people involved in various occupations.
Total number of people = 20000
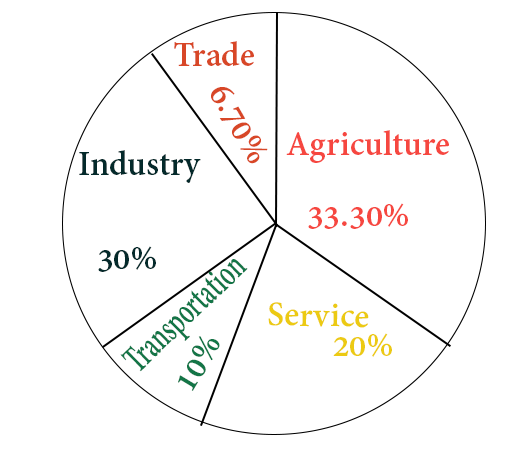
How many more people are involved in service than in trade?
1031 06453a41456b58a42369ad592
6453a41456b58a42369ad592Total number of people = 20000
- 13660false
- 22660true
- 31660false
- 4660false
- Show AnswerHide Answer
- Workspace
- SingleChoice