Data Interpretation Questions Practice Question and Answer
8 Q:Direction: Read the following table carefully and answer the following questions:
Table shows the percentage of male and female employees in different education in a company and total number of males and females:
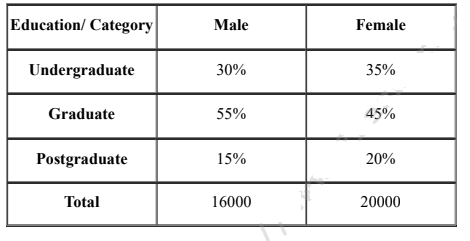
Find the average number of Undergraduate employees in a company.
996 064e750afde1aa1b70fdee97c
64e750afde1aa1b70fdee97c- 16300false
- 26100false
- 35400false
- 45900true
- 56700false
- Show AnswerHide Answer
- Workspace
- SingleChoice
Answer : 4. "5900"
Q:Directions: The Pie chart given here represents the domestic expenditure of a family in per cent. Study the chart and answer the following questions if the total monthly income of the family is ₹ 33,650.
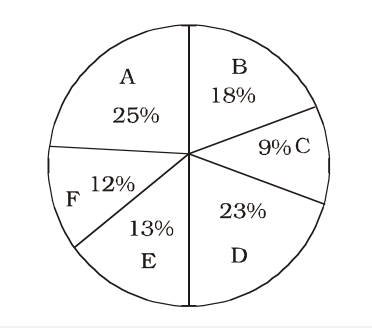
A: Expenditure on food
B: Expenditure on house-rent
C: Expenditure on entertainment
D: Expenditure on education and maintenance of children
E: Medical and miscellaneous expenditure
F: Deductions towards provident fund
The total amount per month, the family spends on food and entertainment combined together, is:
993 0638f3195d319b37ca1826e42
638f3195d319b37ca1826e42- 1₹ 11,432false
- 2₹ 11,441true
- 3₹ 12,315false
- 4₹ 12,443false
- Show AnswerHide Answer
- Workspace
- SingleChoice
Answer : 2. "₹ 11,441"
Q:Directions: Read the below data carefully and answer the following questions.
The table shows the total number of ice cream (Chocobar + Cornetto) was given by Santa Claus on the day of Xmas to 5 children. It also shows the number of Chocobar ice-creams is how much more or less percentage of the total number of Cornetto ice-creams.
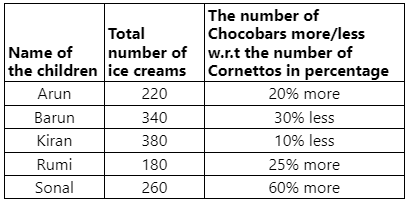
What is the difference between the entire number of Cornettos Arun and Kiran have and therefore the total number of Chocobars Barun and Rumi have?
993 064dcca184e4237f6c98acb94
64dcca184e4237f6c98acb94The table shows the total number of ice cream (Chocobar + Cornetto) was given by Santa Claus on the day of Xmas to 5 children. It also shows the number of Chocobar ice-creams is how much more or less percentage of the total number of Cornetto ice-creams.
- 120false
- 260true
- 330false
- 440false
- 550false
- Show AnswerHide Answer
- Workspace
- SingleChoice
Answer : 2. "60"
Q:The pie graph given here shows the break-up of the cost of construction of a house.
Assuming that the total cost of construction is ₹ 6,00,000, answer the questions.
Break-up of the cost of construction of a house
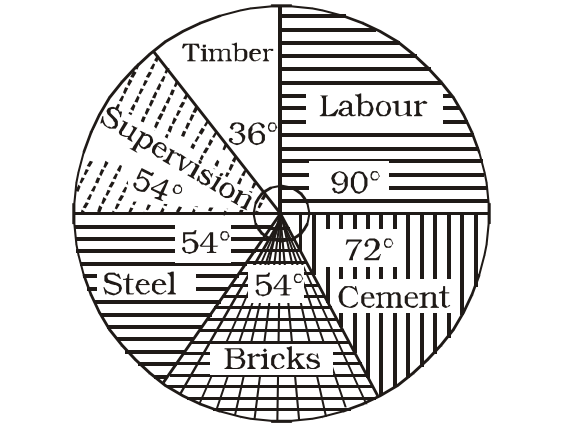
The amount spent on cement, steel and supervision is what percent of the total cost of construction?
992 06332dfac5c208a6bf707bc10
6332dfac5c208a6bf707bc10- 140%false
- 245%false
- 350%true
- 455%false
- Show AnswerHide Answer
- Workspace
- SingleChoice
Answer : 3. "50% "
Q:Directions: Study the Bar diagram carefully and answer the questions.
The Bar diagram shows the trends of foreign direct investment (FDI) into India from all over the World (in Rs. crores).
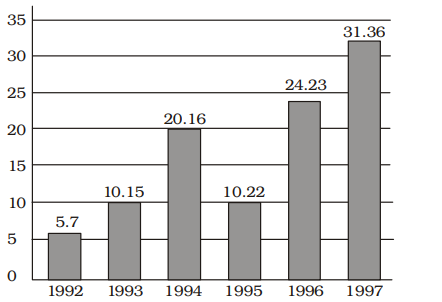
The sum of FDI of 1992 and 1993 is
990 063a569f024e8fb08b9fe1729
63a569f024e8fb08b9fe1729 - 1Rs. 15.58 croresfalse
- 2Rs. 15.85 crorestrue
- 3Rs. 15.22 croresfalse
- 4Rs. 15.65 croresfalse
- Show AnswerHide Answer
- Workspace
- SingleChoice
Answer : 2. "Rs. 15.85 crores "
Q:Directions : Study the following bar graph and answer the questions.
company (in lakhs of rupees) for the years 1994-1997:
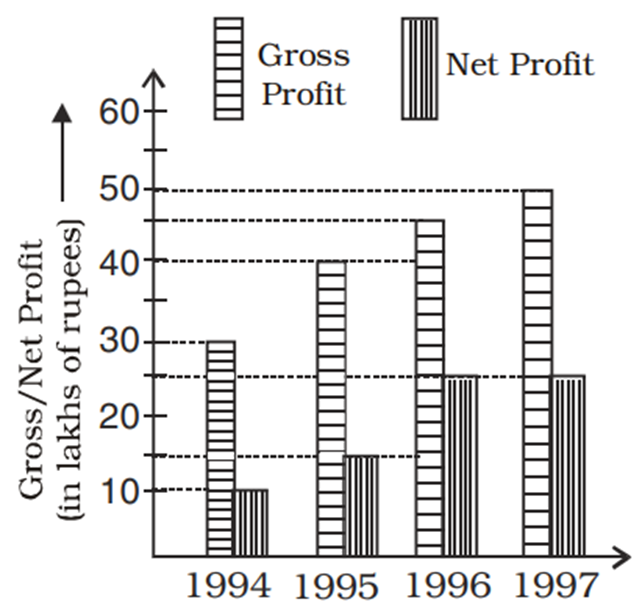
For the entire four years as shown, the ratio of total gross profit to total net profit is
983 06460f6a2cdae930acb7460a3
6460f6a2cdae930acb7460a3- 113 : 4false
- 211 : 6false
- 311 : 5true
- 49 : 4false
- Show AnswerHide Answer
- Workspace
- SingleChoice
Answer : 3. "11 : 5 "
Q:Directions : In an Institution there are 800 students. Students use different modes of transport for going to the institution and return. The given pie diagram represents the requisite data. Study the diagram carefully and answer the questions.

The number of students who go to institute on foot is
981 063ac336e612ead74ab54dc90
63ac336e612ead74ab54dc90- 1160true
- 2170false
- 3120false
- 4106false
- Show AnswerHide Answer
- Workspace
- SingleChoice
Answer : 1. "160 "
Q:Direction: Read the following table carefully and answer the following questions:
Table shows the percentage of male and female employees in different education in a company and total number of males and females:
Find the ratio between the number of female and male employees of postgraduate.
979 064e751fe3be218b6cdc7ecd6
64e751fe3be218b6cdc7ecd6- 11 : 1false
- 22 : 3false
- 33 : 2false
- 45 : 3true
- 54 : 3false
- Show AnswerHide Answer
- Workspace
- SingleChoice