Data Interpretation Questions Practice Question and Answer
8 Q:Directions : The pie graph indicates the break-up of the cost of construction of a house. Assuming that the total cost of construction is Rs 6,00,000, answer the following questions.
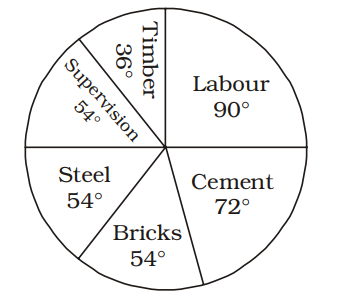
The amount spent on labor exceeds the amount spent on supervision by :
956 063aac38ae541fa7a0123208a
63aac38ae541fa7a0123208a
- 1₹ 1,00,000false
- 2₹ 1,20,000false
- 3₹ 60,000true
- 4₹ 30,000false
- Show AnswerHide Answer
- Workspace
- SingleChoice
Answer : 3. "₹ 60,000 "
Q:Directions: Following is the pie-chart showing the spending of a family on various items in a particular year
Study the pie chart and answer questions
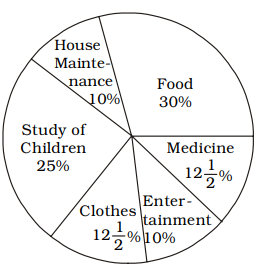
The ratio of the total amount spent for food and medicine is
955 063be6ef28f5b1f774c4c911f
63be6ef28f5b1f774c4c911f- 11 : 2false
- 23 : 1false
- 312 : 5true
- 411 : 5false
- Show AnswerHide Answer
- Workspace
- SingleChoice
Answer : 3. "12 : 5 "
Q:Directions : The Bar Graph given here shows the population (in crores) of India in various census years. Observe the graph and answer the question based on it.
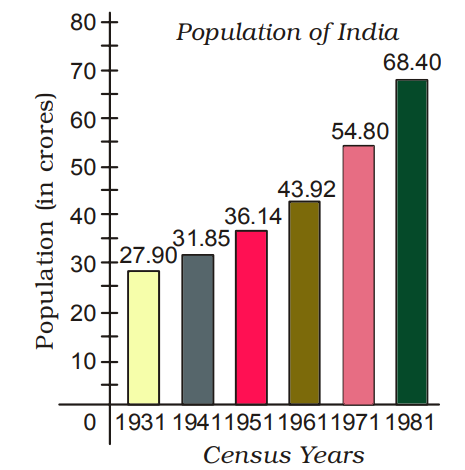
In which census year, the per cent increase in population is least as compared to that in the previous census year?
953 06453a9d1f3618908bf5e24c1
6453a9d1f3618908bf5e24c1- 11961false
- 21951true
- 31971false
- 41941false
- Show AnswerHide Answer
- Workspace
- SingleChoice
Answer : 2. "1951 "
Q:Directions: The bar diagram given below shows the productions (in the unit of thousand pieces) of three types of biscuits by a company in the five consecutive years. Study the diagram and answer the following questions.
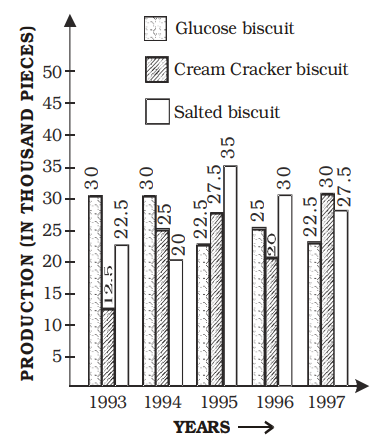
The difference (in the unit of thousand pieces) between the total number of cream cracker biscuits manufactured in the years 1993, 1995 and 1997 and the total number of the biscuits of same type in the years 1994 and 1996 is
952 064899f09b90df94e034c42f4
64899f09b90df94e034c42f4- 115false
- 225true
- 330false
- 420false
- Show AnswerHide Answer
- Workspace
- SingleChoice
Answer : 2. "25 "
Q:Directions: Following is the pie-chart showing the spending of a family on various items in a particular year
Study the pie chart and answer questions
Angle of the pie chart representing the expenditure on entertainment is
950 063be702174eba5069d517362
63be702174eba5069d517362- 115°false
- 210°false
- 336°true
- 426°false
- Show AnswerHide Answer
- Workspace
- SingleChoice
Answer : 3. "36°"
Q:Directions: The table given here shows the production of five types of cars by a company in the year 1989 to 1994. Study the table and answer questions.
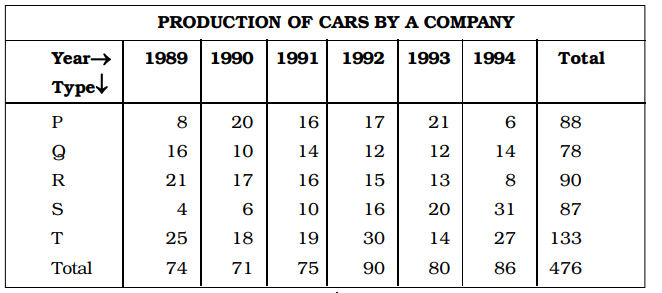
In which year the total production of cars of types P and Q together was equal to the total production of cars of types R and S together?
948 0632db25031300b7ce47a86f9
632db25031300b7ce47a86f9- 11990false
- 21991false
- 31994false
- 4None of the abovetrue
- Show AnswerHide Answer
- Workspace
- SingleChoice
Answer : 4. "None of the above"
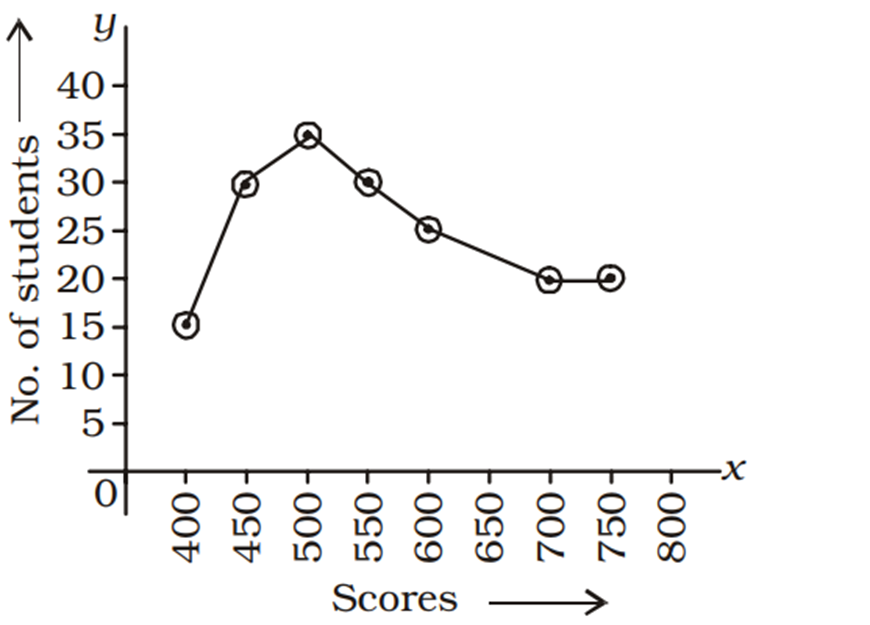
Q: The adjoining diagram is frequency polygon for the scores of students in a test.
What is the total number of students appeared in the test?
947 063ee1c6a7312b71d33e2f206
63ee1c6a7312b71d33e2f206What is the total number of students appeared in the test?
- 1180true
- 2200false
- 3250false
- 4150false
- Show AnswerHide Answer
- Workspace
- SingleChoice
Answer : 1. "180 "
Q:Directions: Degree- wise breakup of employees working in various department of an organisation and the ratio to men to women.
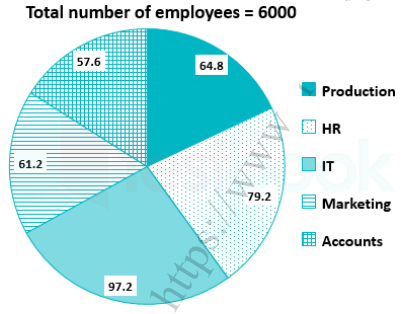
Respective ratio of men to women in each department
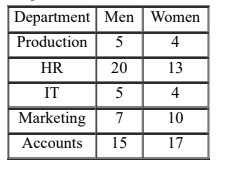
What is the number of men working in the marketing department?
945 064da02a3ebd5c374728ab0d7
64da02a3ebd5c374728ab0d7- 1240false
- 2360false
- 3420true
- 4720false
- 5500false
- Show AnswerHide Answer
- Workspace
- SingleChoice