Data Interpretation Questions Practice Question and Answer
8 Q:Directions: The bar graph, given here, shows the number of tickets sold by 6 students A, B, C, D, E and F during a fair.
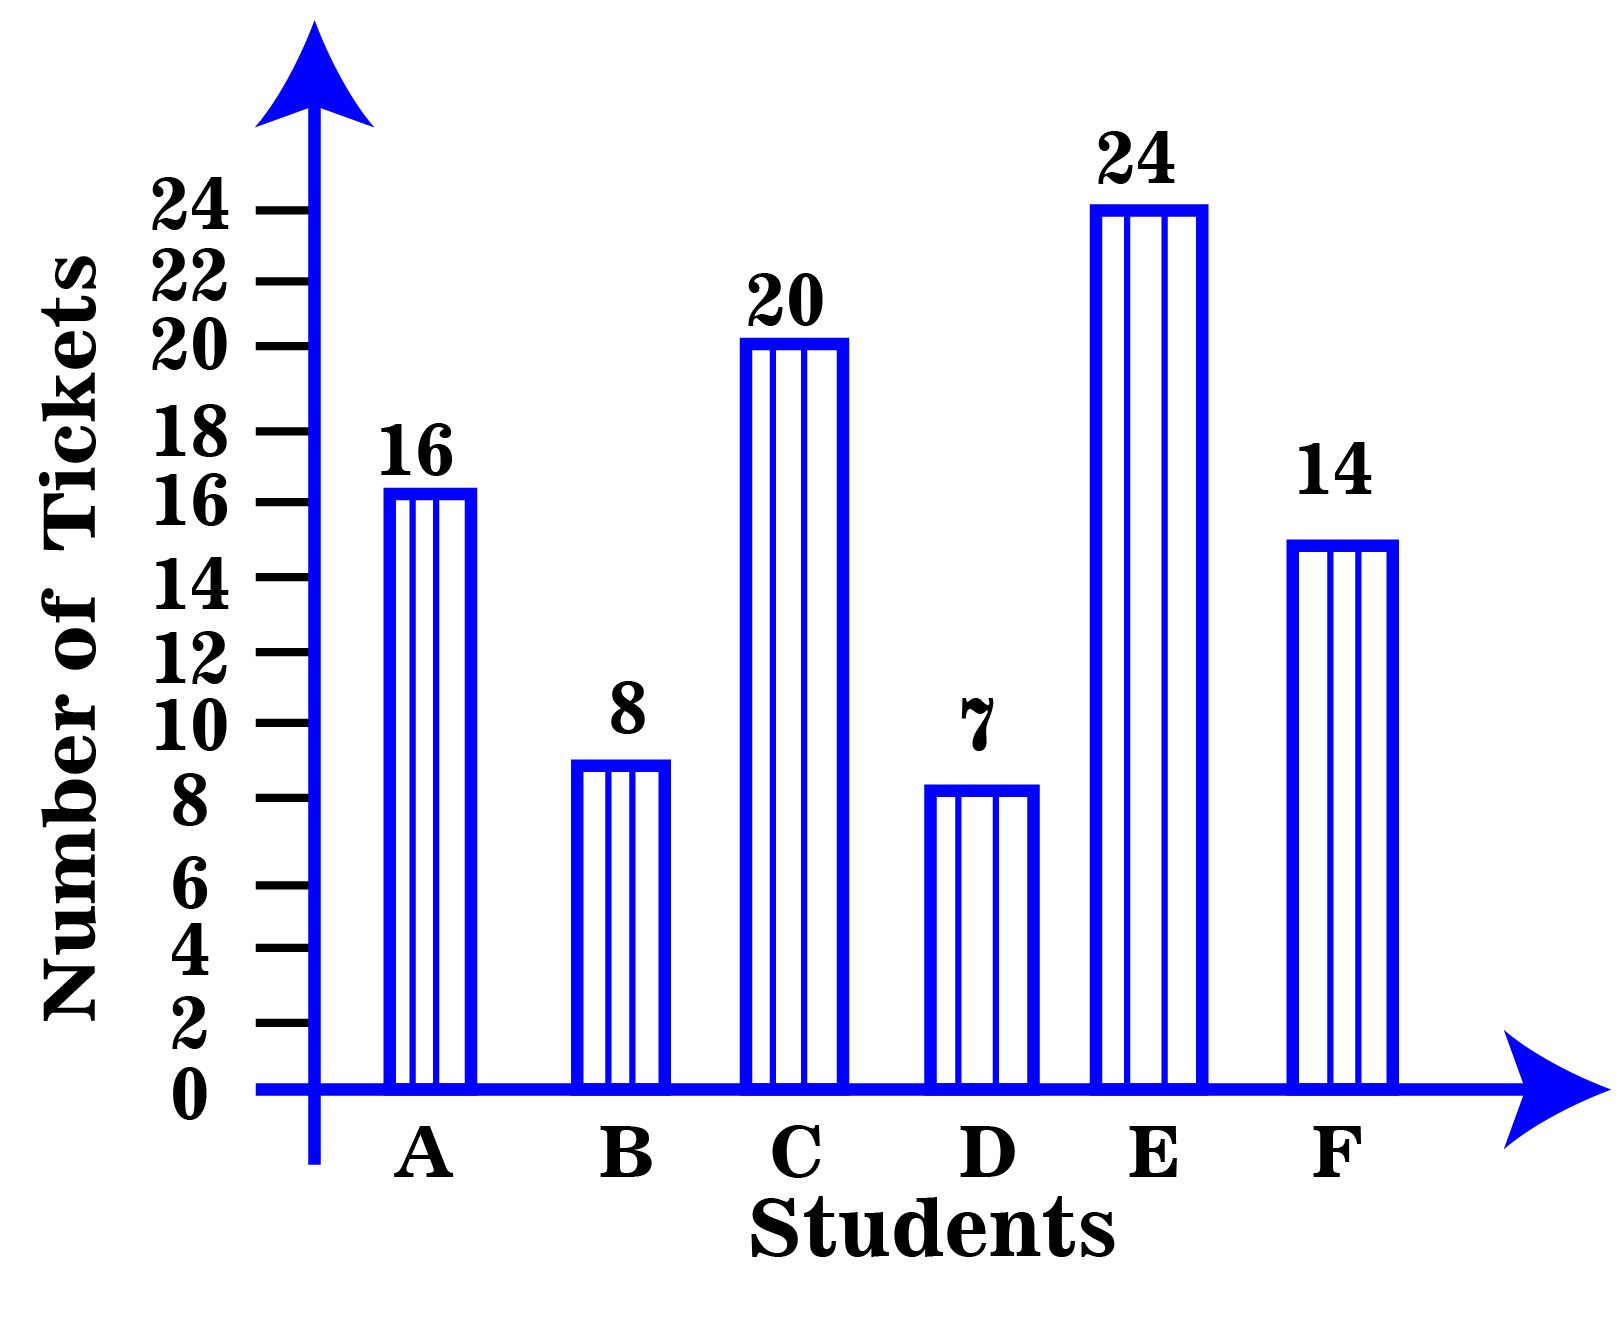
Total number of tickets sold by A, B and C is
2598 05ea81363a63dac4c26cbd00d
5ea81363a63dac4c26cbd00d- 145false
- 244true
- 342false
- 440false
- 5None of thesefalse
- Show AnswerHide Answer
- Workspace
- SingleChoice
Answer : 2. "44 "
Q:Directions:Study the following table carefully to answer these questions:
Percentage of Marks obtained by six students in six subjects

What are the average marks obtained by all the students in Maths ?
2578 05e78a0764572817353d4468f
5e78a0764572817353d4468f- 175false
- 2112.50true
- 3108.50false
- 478false
- 5None of thesefalse
- Show AnswerHide Answer
- Workspace
- SingleChoice
Answer : 2. "112.50 "
Q:Study the following graph to answer these questions :
Percent profit earned by two companies A & B over the years.
Profit = Income – Expenditure
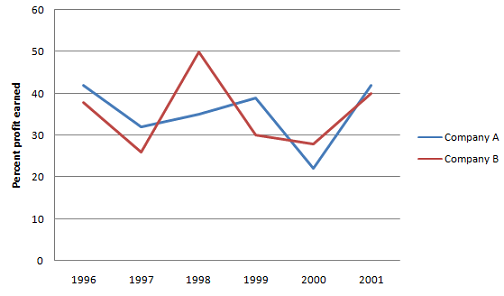
Total expenditure of Company A & B together in 2001 was Rs. 13.5 lakhs. What was the total income of the two companies (in Rs. lakh) in that year?
2571 05e79ada04572817353d62b49
5e79ada04572817353d62b49Percent profit earned by two companies A & B over the years.
Profit = Income – Expenditure
- 119.575false
- 220.25false
- 319.75false
- 4Cannot be determinedtrue
- 5None of thesefalse
- Show AnswerHide Answer
- Workspace
- SingleChoice
Answer : 4. "Cannot be determined"
Q:Pie chart shows the percent of money spent by family on various item during 1999. Study the graph and answer these questions.
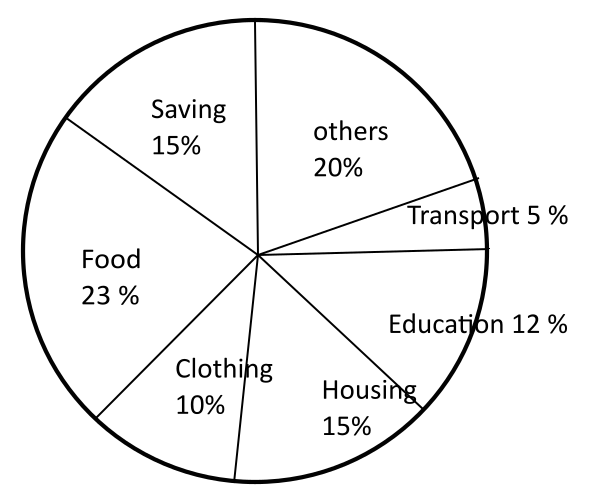
If the total amount spent during the year 1999 was Rs. 46000, the amount spent on food was :
2554 05fb4e3e9488efb77b437fdc8
5fb4e3e9488efb77b437fdc8- 1Rs. 2000false
- 2Rs. 2300false
- 3Rs. 11500false
- 4Rs. 10580true
- Show AnswerHide Answer
- Workspace
- SingleChoice
Answer : 4. "Rs. 10580"
Q: Study the following graph and answer the question that follow.
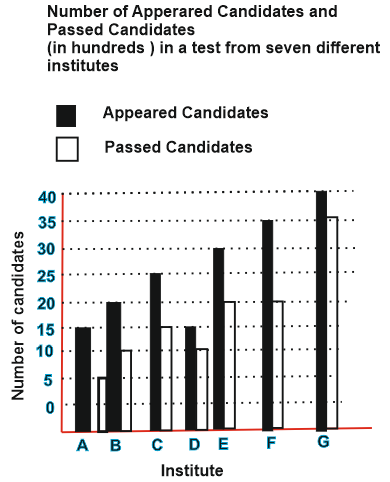 What is the respective ratio between the number of candidates who have failed from institute B and the number of candidates who have appeared from institute F?
2552 05d860deed0d7a00e4ecbb3b8
5d860deed0d7a00e4ecbb3b8What is the respective ratio between the number of candidates who have failed from institute B and the number of candidates who have appeared from institute F?- 11:7false
- 22:5false
- 32:7true
- 41:5false
- 5None of thesefalse
- Show AnswerHide Answer
- Workspace
- SingleChoice
Answer : 3. "2:7"
Q:Directions:Study the following table carefully to answer these questions:
Percentage of Marks obtained by six students in six subjects
What are the total marks obtained by ‘B’ in all the subjects together ?
2524 05e78a4a04572817353d44ba9
5e78a4a04572817353d44ba9- 1336false
- 2223false
- 3446false
- 4273false
- 5None of thesetrue
- Show AnswerHide Answer
- Workspace
- SingleChoice
Answer : 5. "None of these"
Q:Directions : Given line graph shows the data of male & female population in 5 different cities. Read the data carefully and answer the questions.
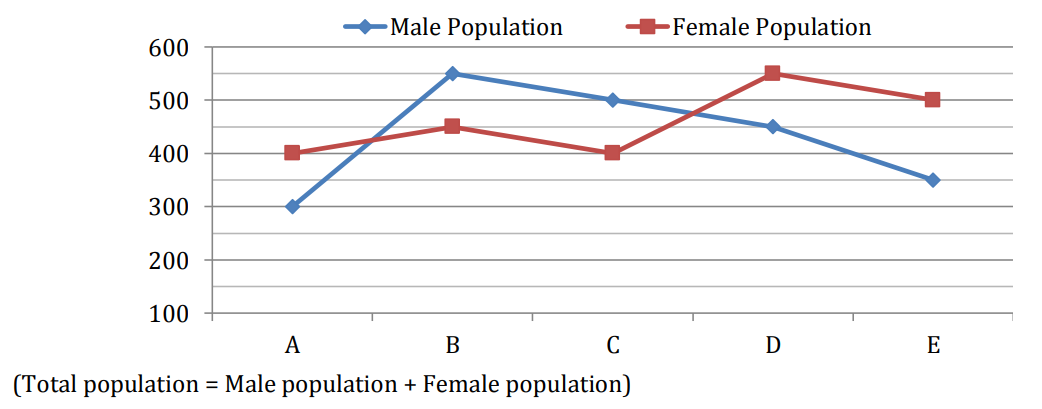
What percent of Female population in city C is male population in city E?
2484 0604088ff0634b252a6b984e6
604088ff0634b252a6b984e6- 190.2%false
- 287.5%true
- 384.5%false
- 485.5%false
- 5114.2%false
- Show AnswerHide Answer
- Workspace
- SingleChoice
Answer : 2. "87.5%"
Q:Study the following pie-diagrams carefully and answer the question given below it.
PERCENTAGE COMPOSITION OF HUMAN BODY
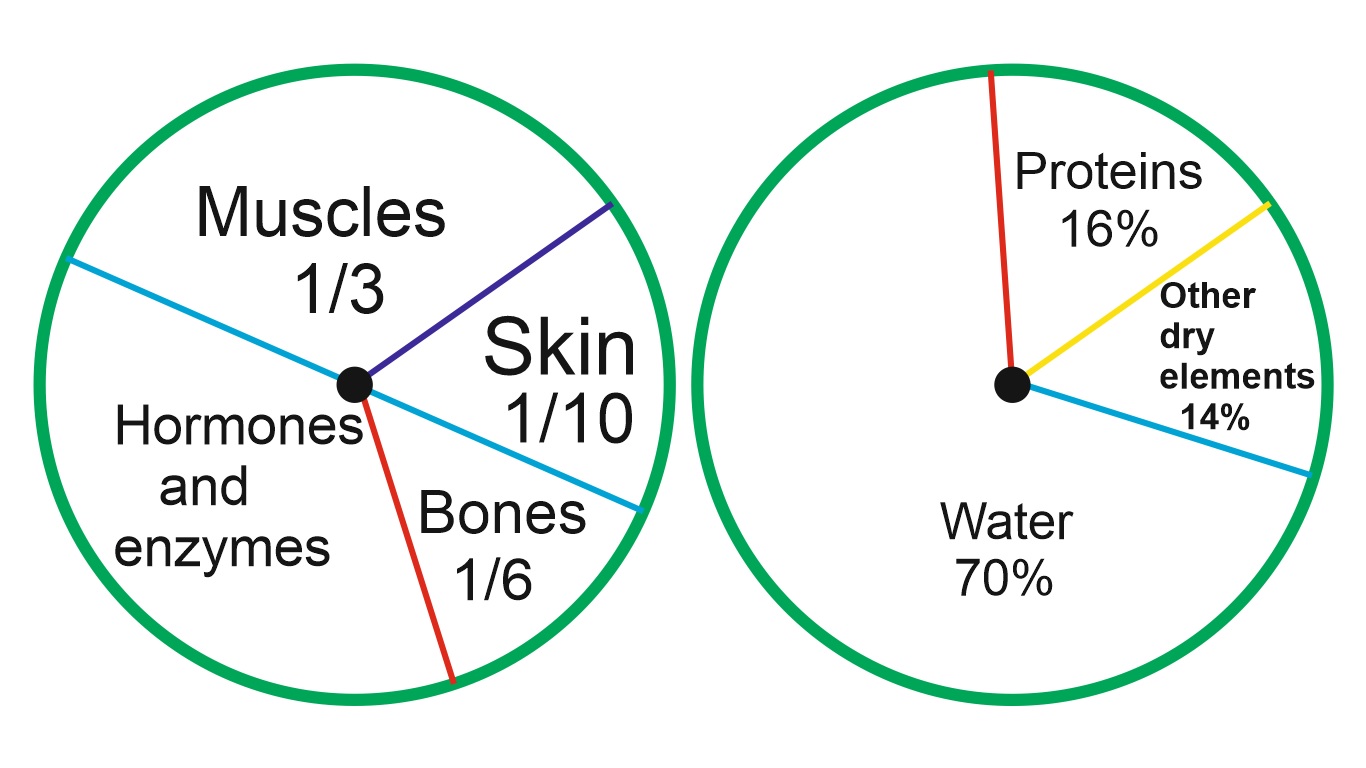
What percent of the total weight of a human body is equivalent to the weight of the proteins in the skin in a human body?
2419 05dcc07f1e9d33d6509bf4c65
5dcc07f1e9d33d6509bf4c65PERCENTAGE COMPOSITION OF HUMAN BODY
- 10.016false
- 21.6true
- 30.16false
- 4Data inadequatefalse
- Show AnswerHide Answer
- Workspace
- SingleChoice