Data Interpretation Questions Practice Question and Answer
8 Q: The table below gives the ranks secured by five different students in three different subjects in a qualifying examination:
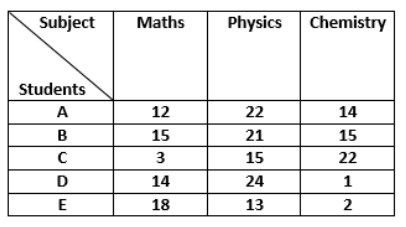
Find the positive difference between the ranks secured by A in Physics and in Maths.
945 06426e16c32185cce37134f5f
6426e16c32185cce37134f5f- 125false
- 210true
- 315false
- 420false
- Show AnswerHide Answer
- Workspace
- SingleChoice
Answer : 2. "10"
Q:Directions: The table given here shows the production of five types of cars by a company in the year 1989 to 1994. Study the table and answer questions.
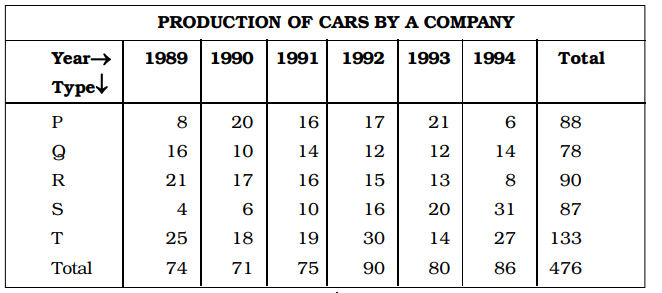
During the period 1989-94, in which type of cars was a continuous increase in production?
944 0632db292751e5310a5d0fb16
632db292751e5310a5d0fb16- 1Pfalse
- 2Qfalse
- 3Rfalse
- 4Strue
- Show AnswerHide Answer
- Workspace
- SingleChoice
Answer : 4. "S"
Q:Directions: Degree- wise breakup of employees working in various department of an organisation and the ratio to men to women.
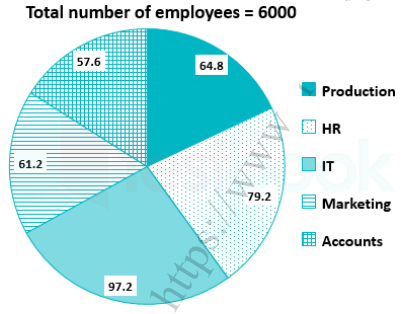
Respective ratio of men to women in each department
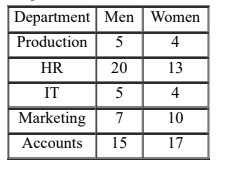
What is the total number of women working in the organisation?
944 064da0531e0ce5574969ef19a
64da0531e0ce5574969ef19a- 12450false
- 22830true
- 32520false
- 42480false
- 53320false
- Show AnswerHide Answer
- Workspace
- SingleChoice
Answer : 2. "2830"
Q:Directions: Study the following information carefully and answer the questions given below.
In the table, the percentage of shirts (formal and casual) sold out of the total number of shirts sold in the week and the number of casual shirts sold data related to the number of shirts sold on ve weekdays – Monday, Tuesday, Wednesday, Thursday and Friday are given.
Total number of shirts sold in the week = x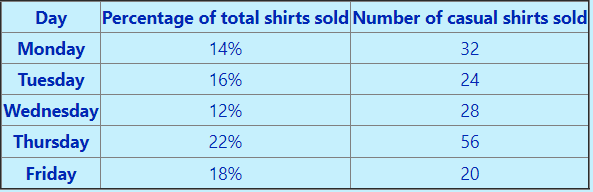 Note: Total number of shirts sold on Saturday and Sunday together = 72
What is the sum of the formal shirts sold on Monday, Tuesday and Wednesday together?
944 064e5edc9d928d8b7160e3c6a
64e5edc9d928d8b7160e3c6aIn the table, the percentage of shirts (formal and casual) sold out of the total number of shirts sold in the week and the number of casual shirts sold data related to the number of shirts sold on ve weekdays – Monday, Tuesday, Wednesday, Thursday and Friday are given.
Note: Total number of shirts sold on Saturday and Sunday together = 72- 1102false
- 2168false
- 384true
- 464false
- 5None of thesefalse
- Show AnswerHide Answer
- Workspace
- SingleChoice
Answer : 3. "84"
Q:Directions: The pie– chart shows the proposed outlay for different sectors during a Five–Year plan of Government of India. Total outlay is Rs. 40,000 crores. By reading the pie–chart answer the following three questions.
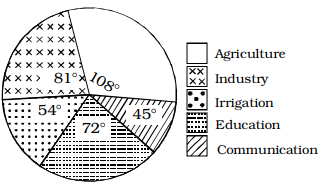
What is the ratio between the proposed outlay of Irrigation and Communication?
943 06489a579b50f5316a45e07b1
6489a579b50f5316a45e07b1- 19 : 8false
- 23 : 2false
- 39 : 5false
- 46 : 5true
- Show AnswerHide Answer
- Workspace
- SingleChoice
Answer : 4. "6 : 5"
Q:Directions: The bar diagram given below shows the productions (in the unit of thousand pieces) of three types of biscuits by a company in the five consecutive years. Study the diagram and answer the following questions.
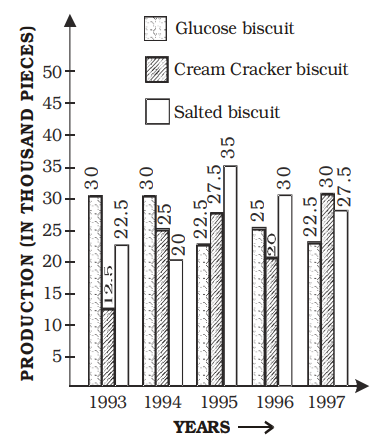
The ratio of production of glucose biscuits and total production of biscuits in that year was maximum in
942 06489af13b50f5316a45e39c2
6489af13b50f5316a45e39c2- 11994false
- 21993false
- 31996false
- 41997true
- Show AnswerHide Answer
- Workspace
- SingleChoice
Answer : 4. "1997"
Q:Directions : Read the graph and answer the following questions.
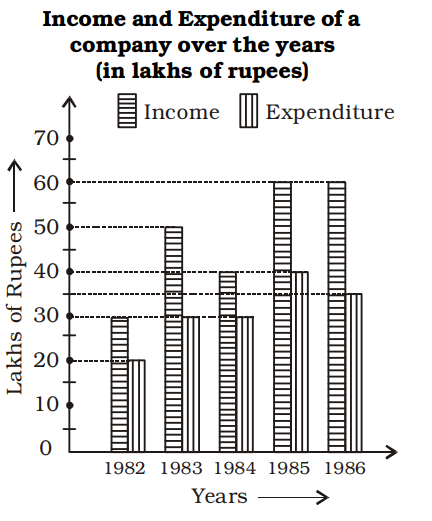
What is the difference in profit between 1983 and 1984 (in lakhs of rupees) ?
941 06461024745f1450a80c4103d
6461024745f1450a80c4103d- 1No profitfalse
- 25false
- 310true
- 415false
- Show AnswerHide Answer
- Workspace
- SingleChoice
Answer : 3. "10 "
Q:Directions: The sub divided bar diagram given below depicts Higher secondary Students of a school for three years. Study the diagram and answer the questions

The percentage passed in 1st division in 2008 was
936 0645ce5b945f1450a80b9e89d
645ce5b945f1450a80b9e89d- 127%false
- 232%false
- 3$$15{3\over 8}\% $$false
- 4$$11{13\over 17}\% $$true
- Show AnswerHide Answer
- Workspace
- SingleChoice