Data Interpretation Questions Practice Question and Answer
8 Q:Direction: Study the following graph carefully and answer the questions that follow:
The graph given below represents the number of users of two broadband services A and B across 5 cities P, Q, R, S and T.
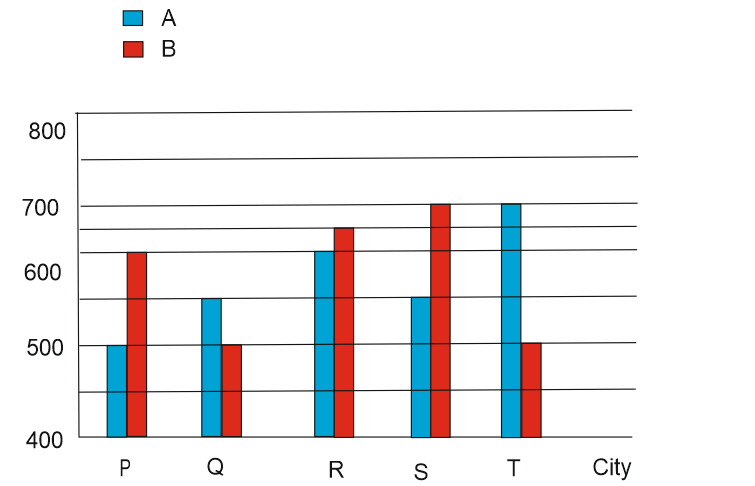
The number of users of brand A in city T is what percent of the number of users of brand B in city Q?
1605 05df0bc51e837331209ea1929
5df0bc51e837331209ea1929The graph given below represents the number of users of two broadband services A and B across 5 cities P, Q, R, S and T.
- 1150false
- 2110false
- 3140true
- 4160false
- 5120false
- Show AnswerHide Answer
- Workspace
- SingleChoice
Answer : 3. "140"
Q:Direction: Study the following graph carefully and answer the questions that follow:
The graph given below represents the number of users of two broadband services A and B across 5 cities P, Q, R, S and T.
What is the total number of users of brand B across all five cities together?
1595 05df0bb273d76f974e561f39e
5df0bb273d76f974e561f39eThe graph given below represents the number of users of two broadband services A and B across 5 cities P, Q, R, S and T.
- 12700false
- 23000true
- 33100false
- 42900false
- 53200false
- Show AnswerHide Answer
- Workspace
- SingleChoice
Answer : 2. "3000"
Q:Directions: The bar graph given below shows the spending of family income on various items and savings during 1993. Observe the graph and answer the following questions:
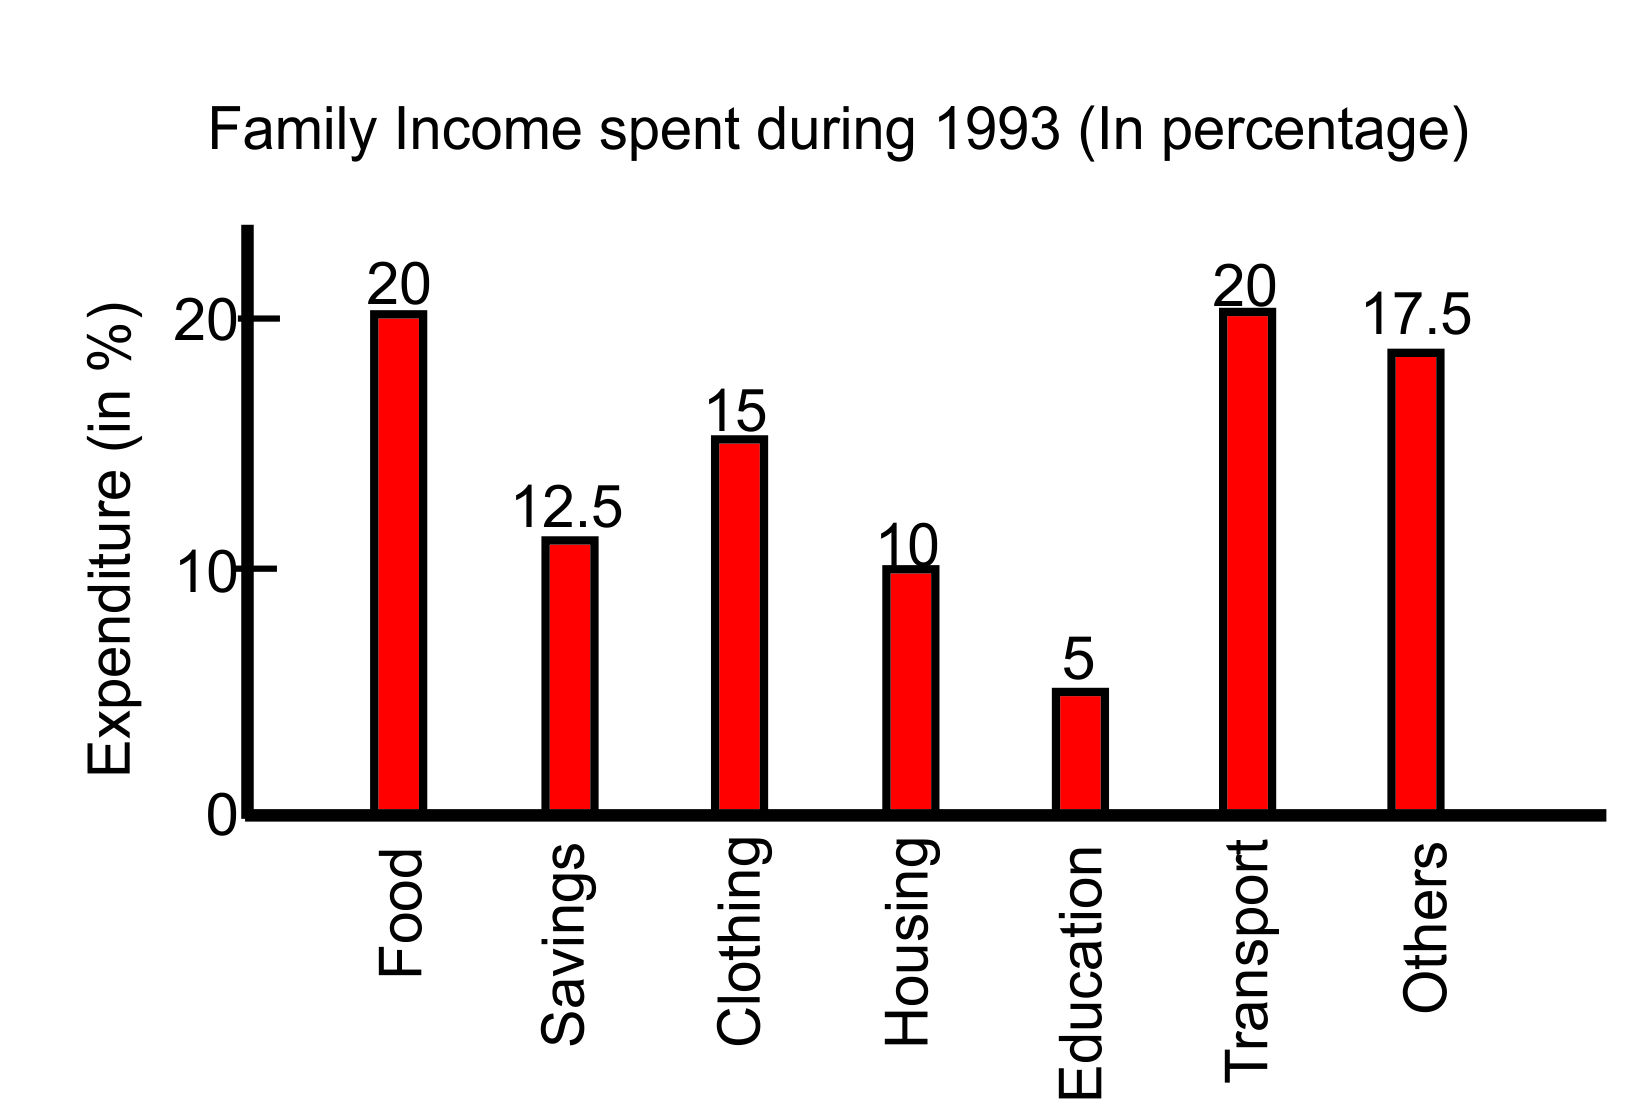
The savings of the family is more than that of expenditure incurred on:
2040 05def3f82806c5b05d54f26b3
5def3f82806c5b05d54f26b3- 1housingtrue
- 2clothingfalse
- 3transportfalse
- 4othersfalse
- Show AnswerHide Answer
- Workspace
- SingleChoice
Answer : 1. "housing "
Q:Directions: The bar graph given below shows the spending of family income on various items and savings during 1993. Observe the graph and answer the following questions:
The total expenses of the family on transport is equal to those spent on:
1425 05def3eea806c5b05d54f2644
5def3eea806c5b05d54f2644- 1savingsfalse
- 2clothingfalse
- 3foodtrue
- 4othersfalse
- Show AnswerHide Answer
- Workspace
- SingleChoice
Answer : 3. "food "
Q:Directions: The bar graph given below shows the spending of family income on various items and savings during 1993. Observe the graph and answer the following questions:
If the total income of the family during 1993 was ₹ 100000, the savings of the family in 1993 was:
1865 05def3e2d6d799a05c00a5ec8
5def3e2d6d799a05c00a5ec8- 1₹1,750false
- 2₹20,000false
- 3₹12,500true
- 4₹50,000false
- Show AnswerHide Answer
- Workspace
- SingleChoice
Answer : 3. "₹12,500 "
Q:Directions: The bar graph given below shows the spending of family income on various items and savings during 1993. Observe the graph and answer the following questions:
The percent of income spent on clothing exceeds that on savings by :
1603 05def3b986d799a05c00a472c
5def3b986d799a05c00a472c- 112.5 %false
- 22.5 %true
- 310%false
- 422.5 %false
- Show AnswerHide Answer
- Workspace
- SingleChoice
Answer : 2. "2.5 % "
Q:Directions: The bar graph given below shows the spending of family income on various items and savings during 1993. Observe the graph and answer the following questions:
The percent of income spent on food is:
1538 05def3b1b5b0f1b05dcfc4452
5def3b1b5b0f1b05dcfc4452- 15 %false
- 210 %false
- 312.5 %false
- 420 %true
- Show AnswerHide Answer
- Workspace
- SingleChoice
Answer : 4. "20 % "
Q:The following pie-chart shows the monthly expenditure of family on various items. If the family spends Rs. 825 on clothing answer the question
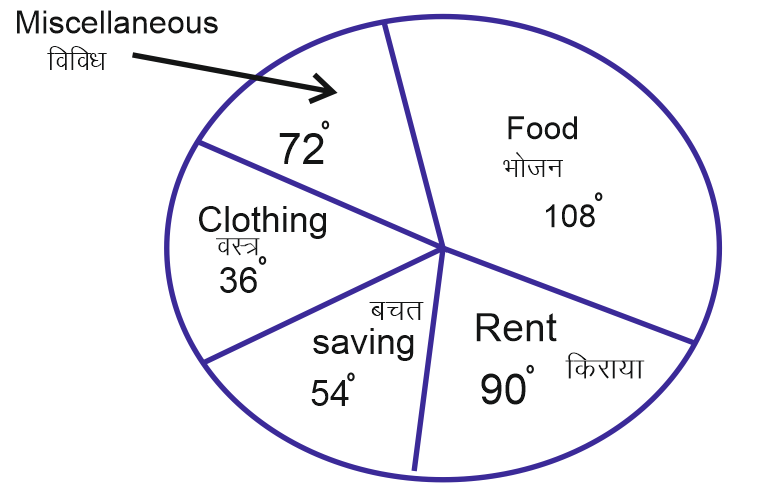
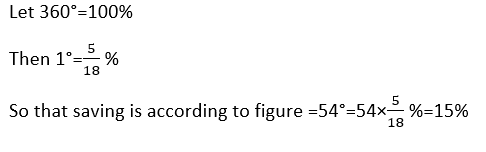
What percent of the total income does the family save
1655 05de4e15d76066724df64c321
5de4e15d76066724df64c321- 115 %true
- 250%false
- 320%false
- 425%false
- Show AnswerHide Answer
- Workspace
- SingleChoice
Answer : 1. "15 %"
Explanation :