Data Interpretation Questions Practice Question and Answer
8 Q:Direction: Study the following line graph carefully and answer the questions given below.
In the below line graph, the number of animals in two zoo A and B in the years – 2001, 2003, 2005 and 2007 is given.
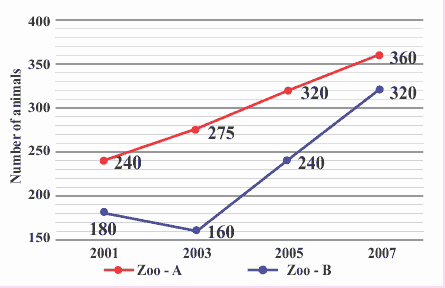
Sum of the number of animals in zoo-B in the years 2001, 2003 and 2005 together is what per cent more/less than the sum of the number of animals in zoo-A in the years 2001 and 2007 together?
877 064e5dc21640c09b72f94d305
64e5dc21640c09b72f94d305In the below line graph, the number of animals in two zoo A and B in the years – 2001, 2003, 2005 and 2007 is given.
- 1$$6 {1\over 4}$$ %false
- 2$$5{1\over 3}$$ %false
- 3$$3 {1\over 3}$$ %true
- 4$$8 {1\over 3}$$ %false
- 5None of thesefalse
- Show AnswerHide Answer
- Workspace
- SingleChoice
Answer : 3. "$$3 {1\over 3}$$ %"
Q:Directions : Given here is a pie chart showing the cost of gold in 2010, 2011, 2012 and 2013. Study the chart and answer the following questions
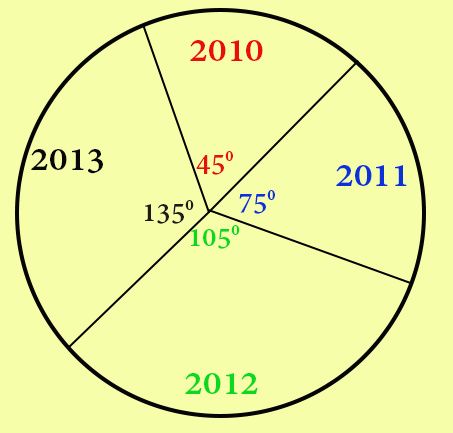
The percentage increase in the price of gold from the year 2011 to 2013 is
877 064539e95f3618908bf5e0c4e
64539e95f3618908bf5e0c4e- 150%false
- 260%false
- 370%false
- 480%true
- Show AnswerHide Answer
- Workspace
- SingleChoice
Answer : 4. "80%"
Q:Directions: The following pie chart show proportion of population of seven villages in 2009. Stud the pie chart and answer question that follows:
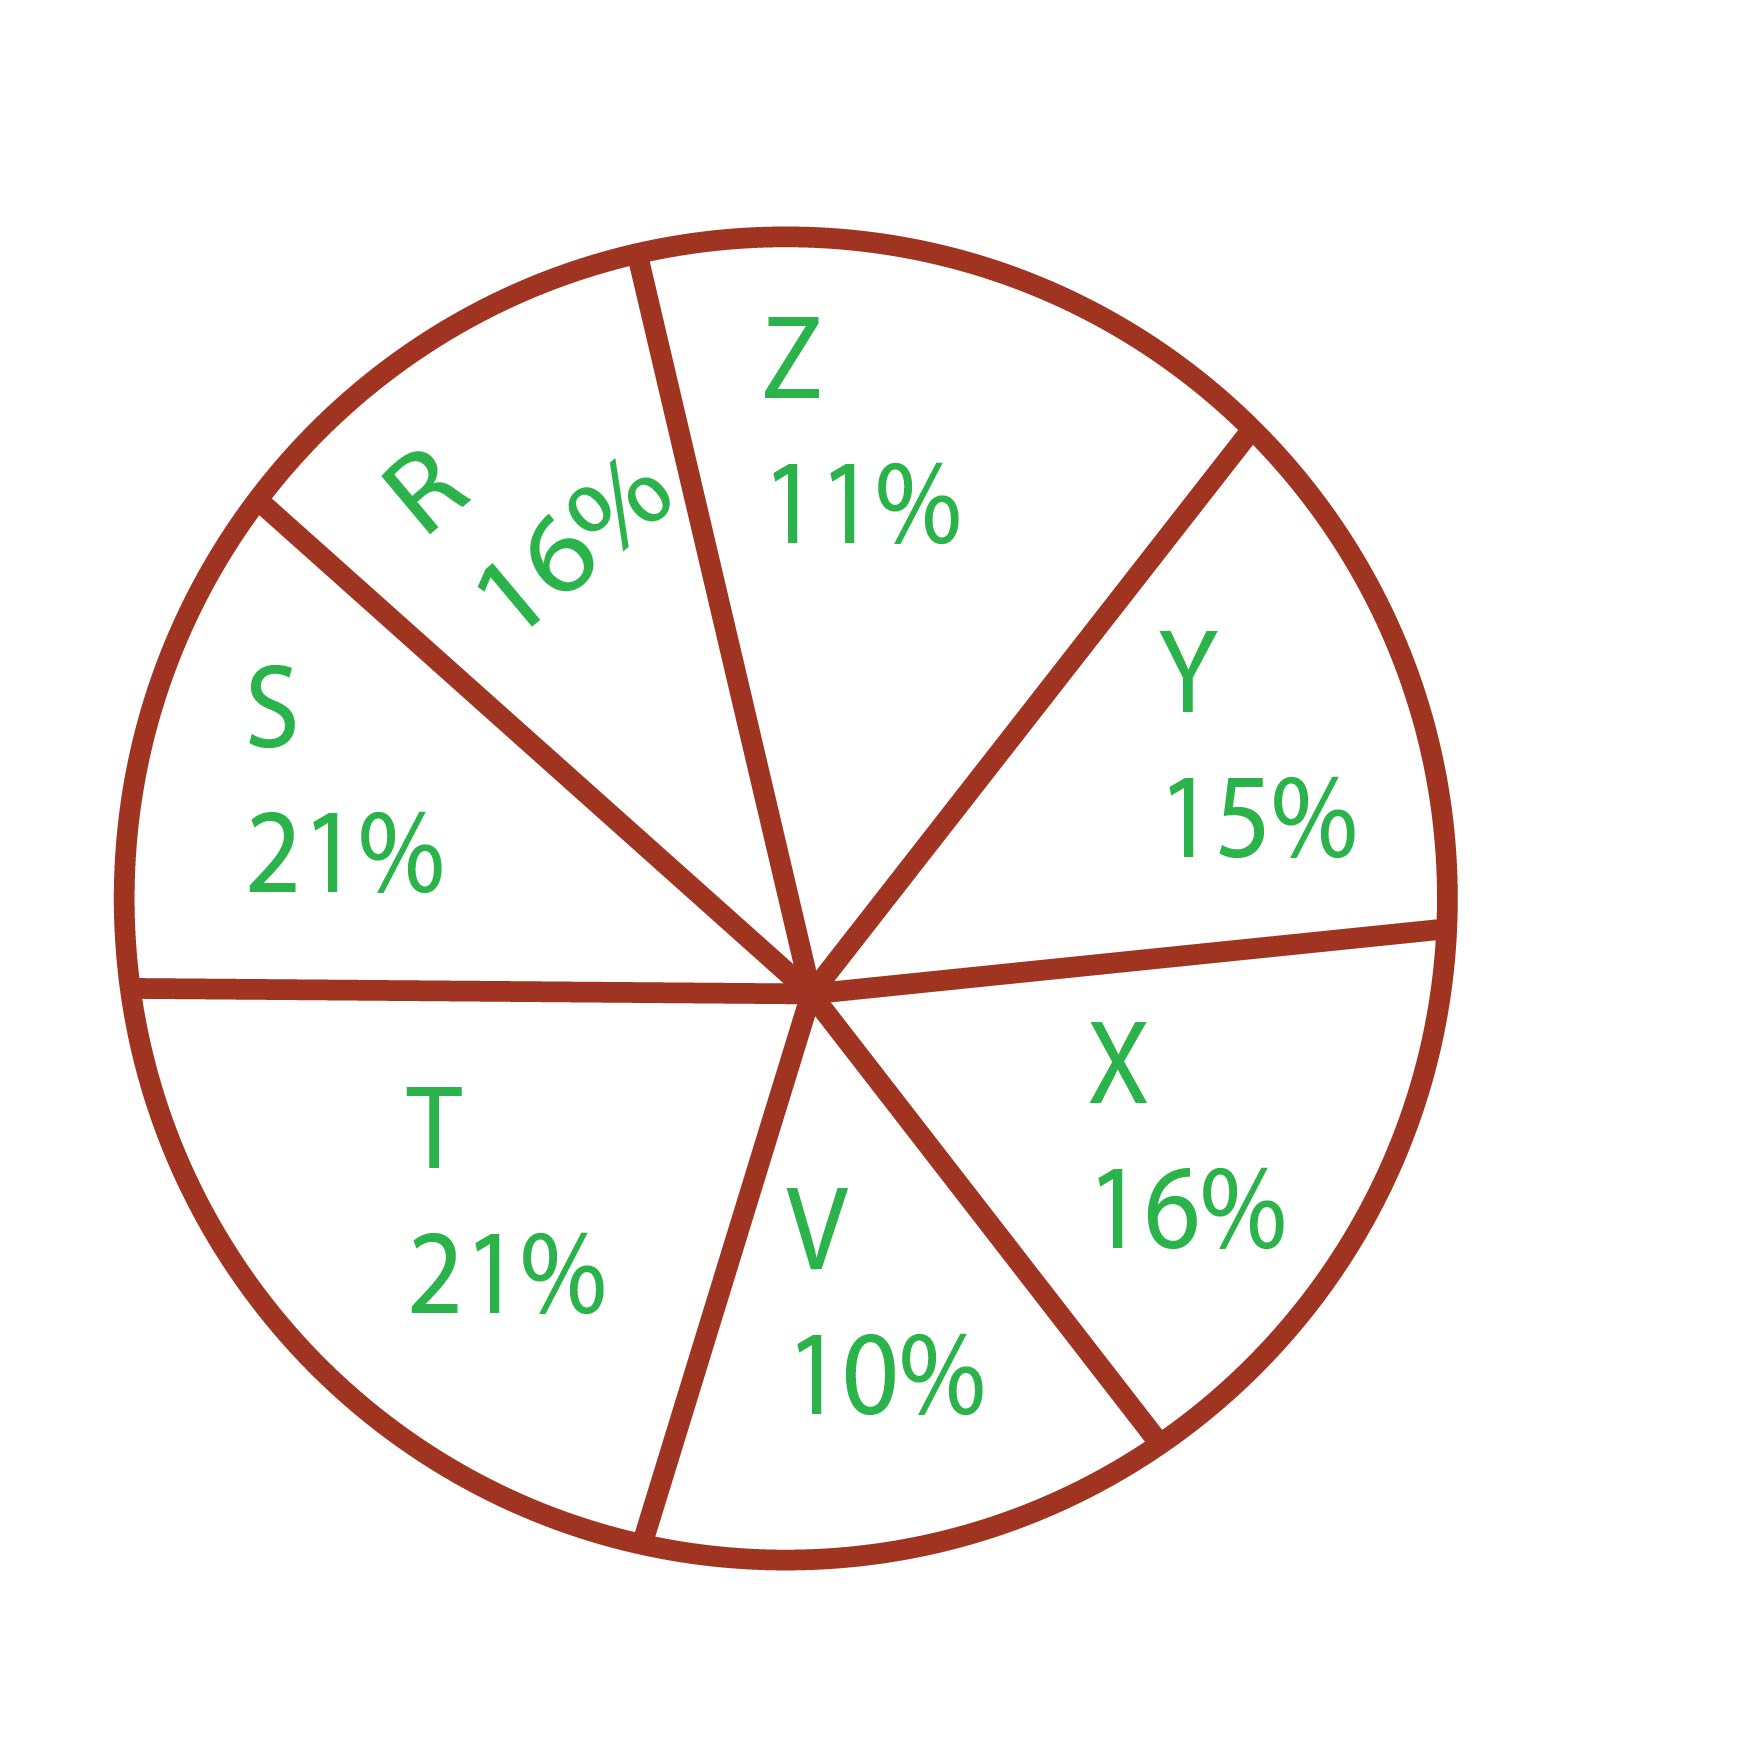
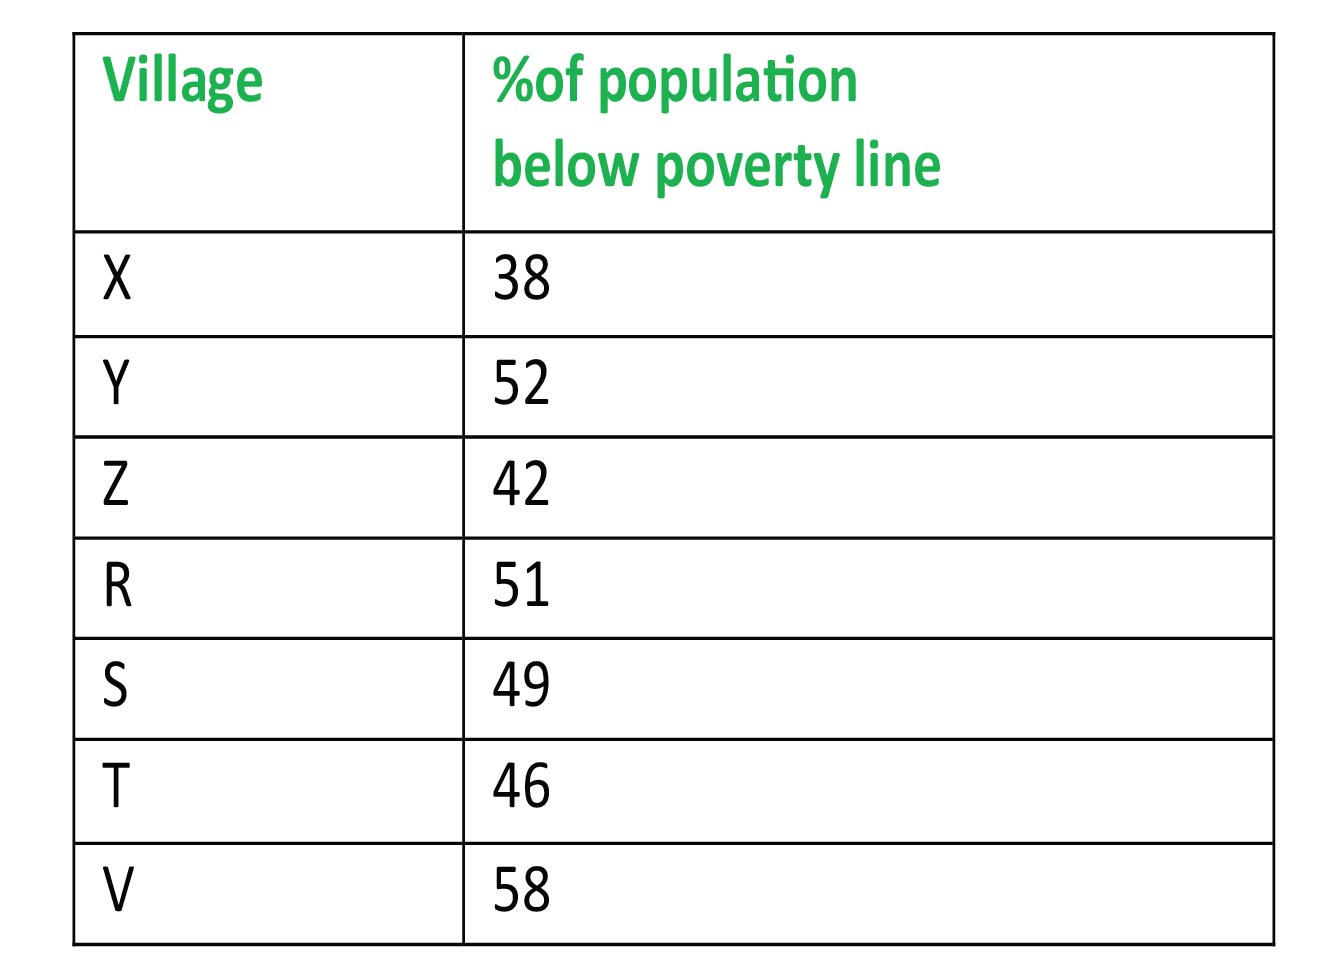
If the population of the village 'R' is 32000, then the below poverty line population of village Y is
876 06408805736c856ead7992198
6408805736c856ead7992198- 114100false
- 215600true
- 316500false
- 417000false
- Show AnswerHide Answer
- Workspace
- SingleChoice
Answer : 2. "15600"
Q:Directions: The sub divided bar diagram given below depicts Higher secondary Students of a school for three years. Study the diagram and answer the questions

The percentage of the students passed with 2nd division in the year 2010 was
876 0645ce8abe67f3b0a568e543a
645ce8abe67f3b0a568e543a- 130%true
- 240%false
- 350%false
- 460%false
- Show AnswerHide Answer
- Workspace
- SingleChoice
Answer : 1. "30% "
Q:Directions : A bar graph showing the heights of six mountain peaks is given below. Study the bar graph and answer the questions.

Which peak is the second highest ?
871 063930c38d319b37ca19af109
63930c38d319b37ca19af109- 1Bfalse
- 2Ctrue
- 3Afalse
- 4Efalse
- Show AnswerHide Answer
- Workspace
- SingleChoice
Answer : 2. "C "
Q:Direction: Study the given pie chart carefully and answer the following questions accordingly. Given pie chart shows the percentage of players taking part in six different games in an event.
Total number of Players = 1800
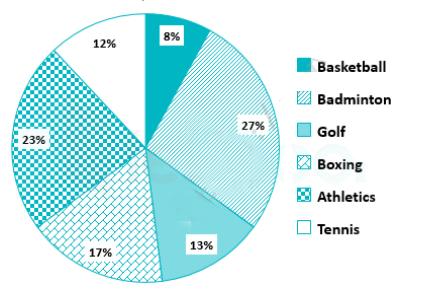
If the percentage of Golf players is increased by 50% and the percentage of Basketball players decreased by 25%, then what will be the new total number of Golf and Basketball players together?
869 064e75e0913f72deddceb359f
64e75e0913f72deddceb359f- 1390false
- 2379false
- 3459true
- 4480false
- 5None of thesefalse
- Show AnswerHide Answer
- Workspace
- SingleChoice
Answer : 3. "459"
Q:Directions : Study the following pie chart carefully and answer the questions. The pie chart represents the percentage of people involved in various occupations.
Total number of people = 20000
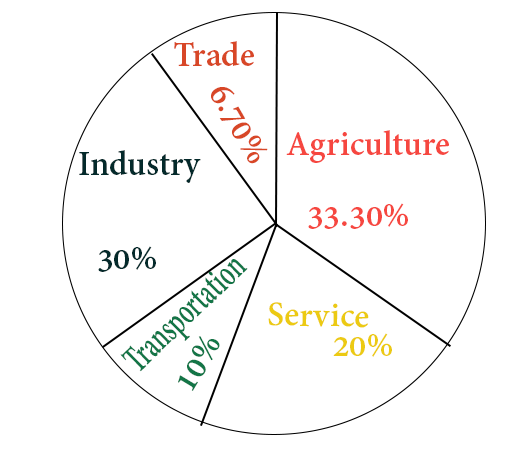
The difference between the maximum number of people involved and minimum number of people involved in various professions is
867 06453a55339143d085f3e5a73
6453a55339143d085f3e5a73Total number of people = 20000
- 12640false
- 23640false
- 36320false
- 45320true
- Show AnswerHide Answer
- Workspace
- SingleChoice
Answer : 4. "5320"
Q:Directions : Study the following bar graph and answer the questions.
company (in lakhs of rupees) for the years 1994-1997:
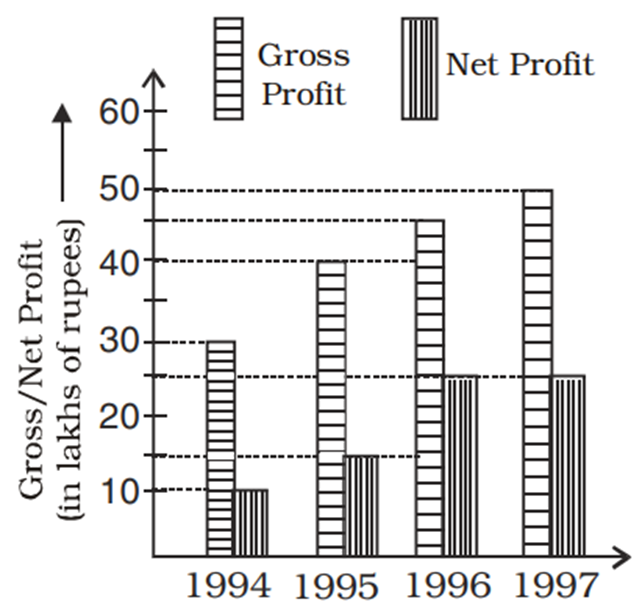
The ratio of gross profit to net profit in a year was greatest in the year
864 06460f638cdae930acb746048
6460f638cdae930acb746048- 11994true
- 21995false
- 31996false
- 41997false
- Show AnswerHide Answer
- Workspace
- SingleChoice