Data Interpretation Questions Practice Question and Answer
8 Q:Directions : The following graph shows production (in thousands) of two types (P and Q) of vehicles by a factory over the years 2009 to 2014. Study the graph and answer the given questions.
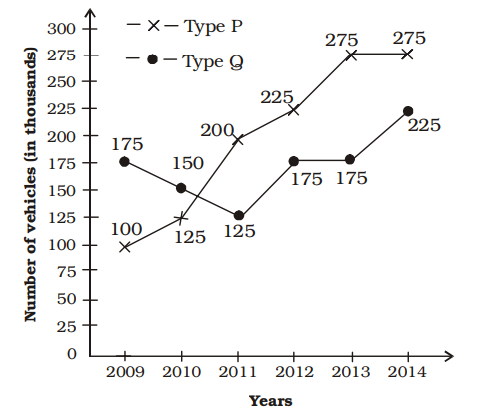
The production of Type Q vehicles in 2010 was approximately what percent of Type P vehicles in 2014?
862 063a56e408fc9692134069535
63a56e408fc9692134069535 - 160false
- 245.5false
- 354.5true
- 475false
- Show AnswerHide Answer
- Workspace
- SingleChoice
Answer : 3. "54.5 "
Q:Directions: The following pie chart show proportion of population of seven villages in 2009. Stud the pie chart and answer question that follows:
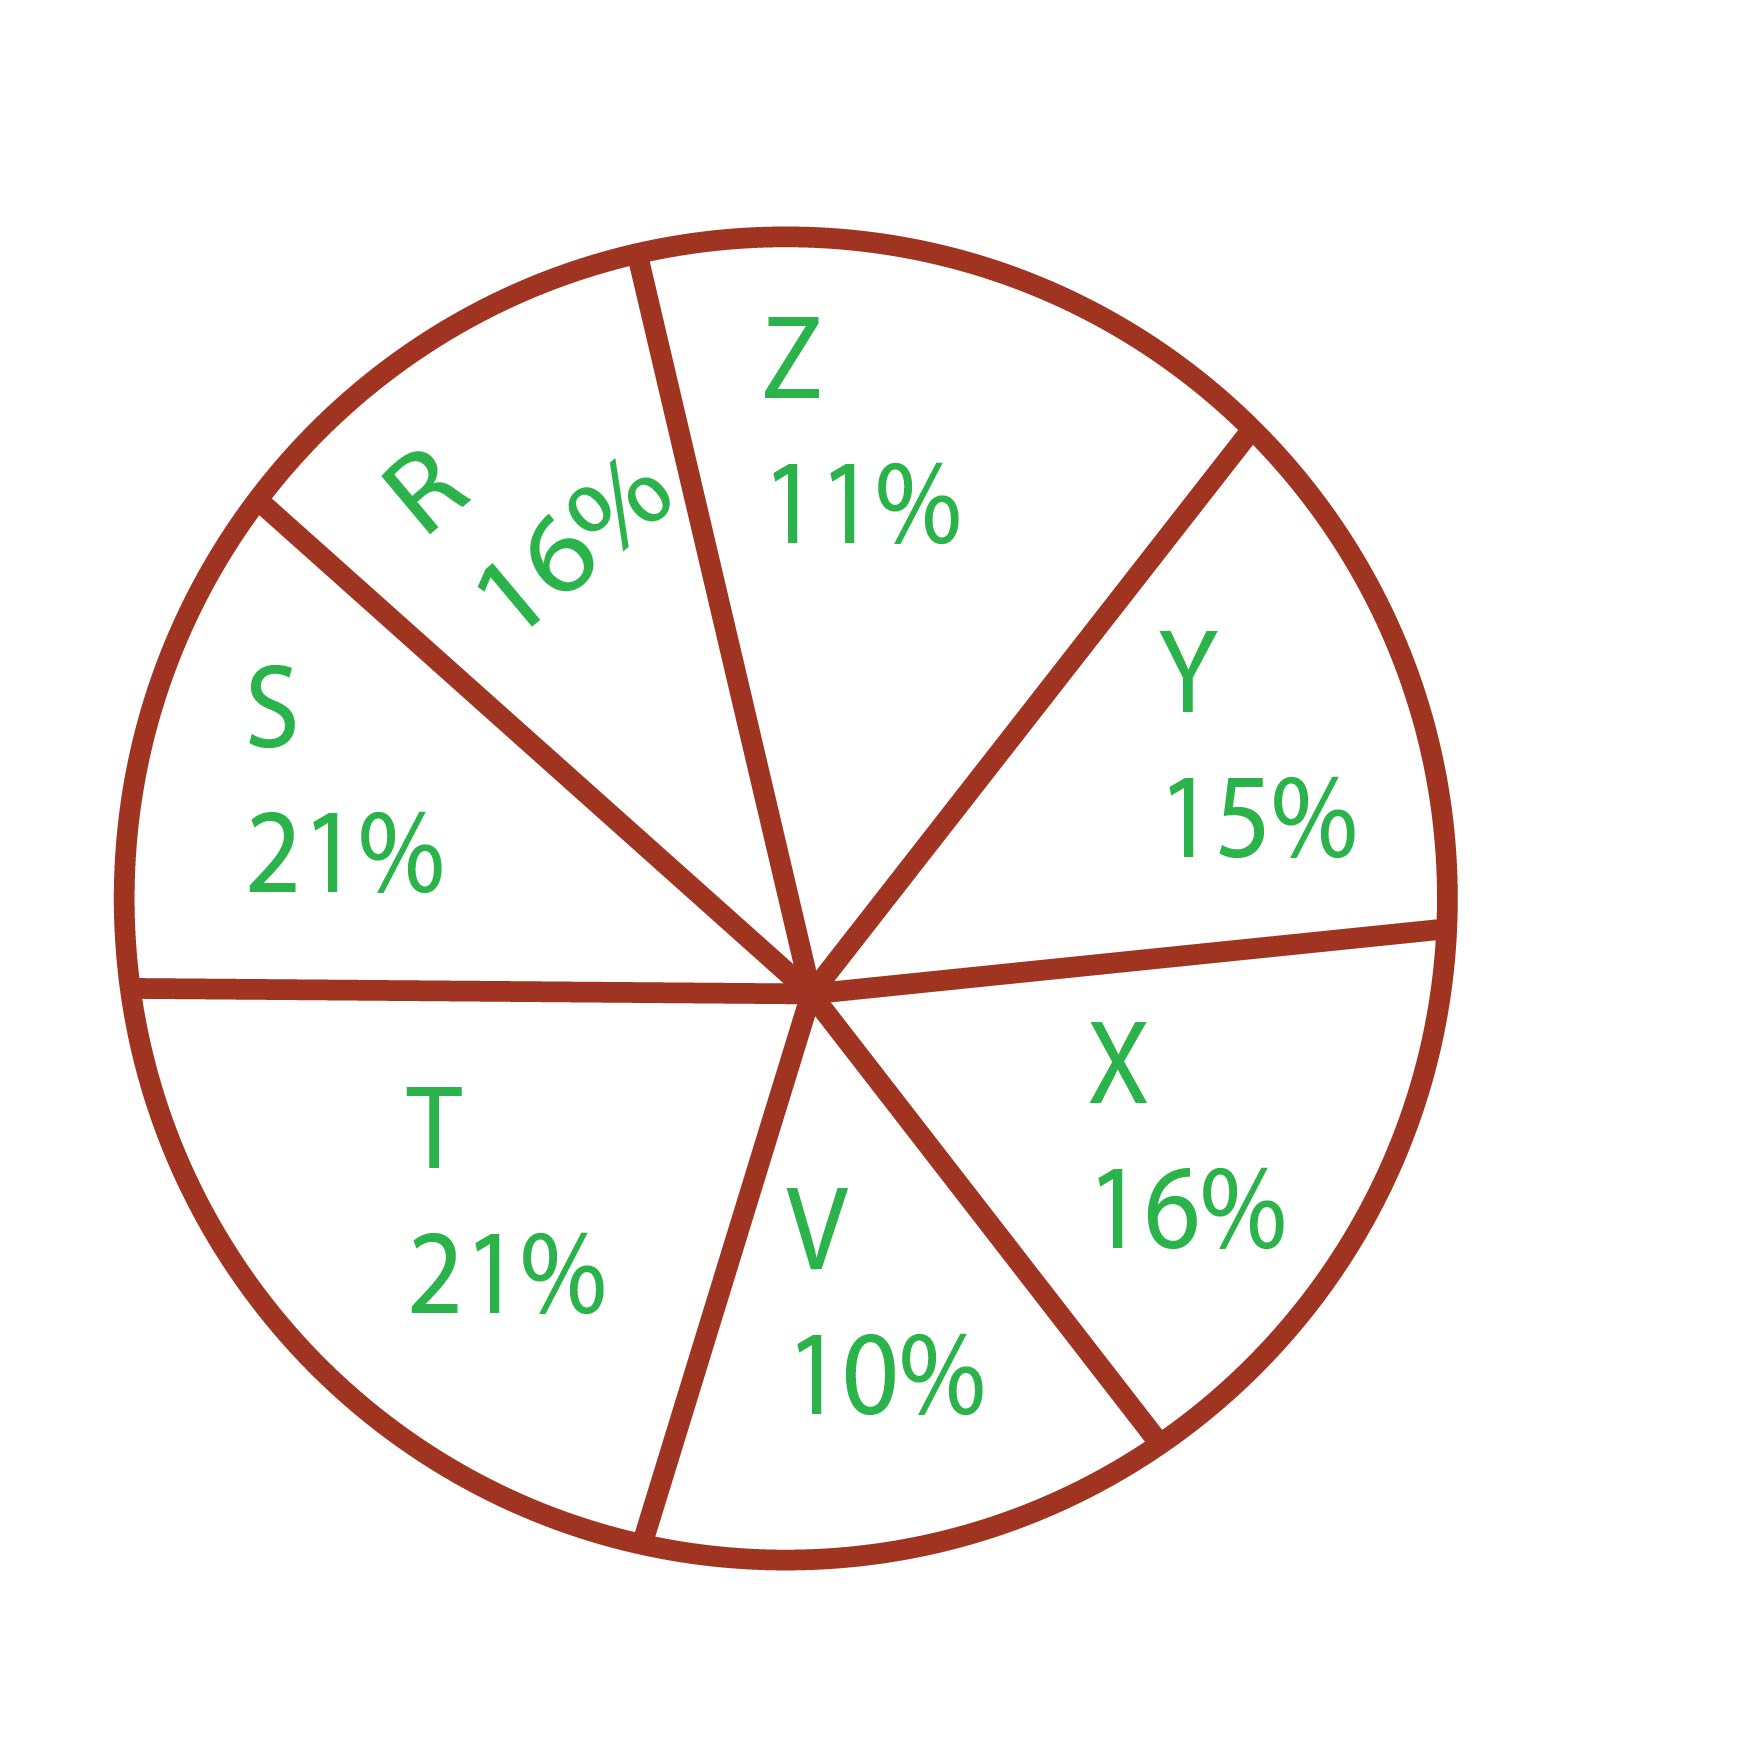
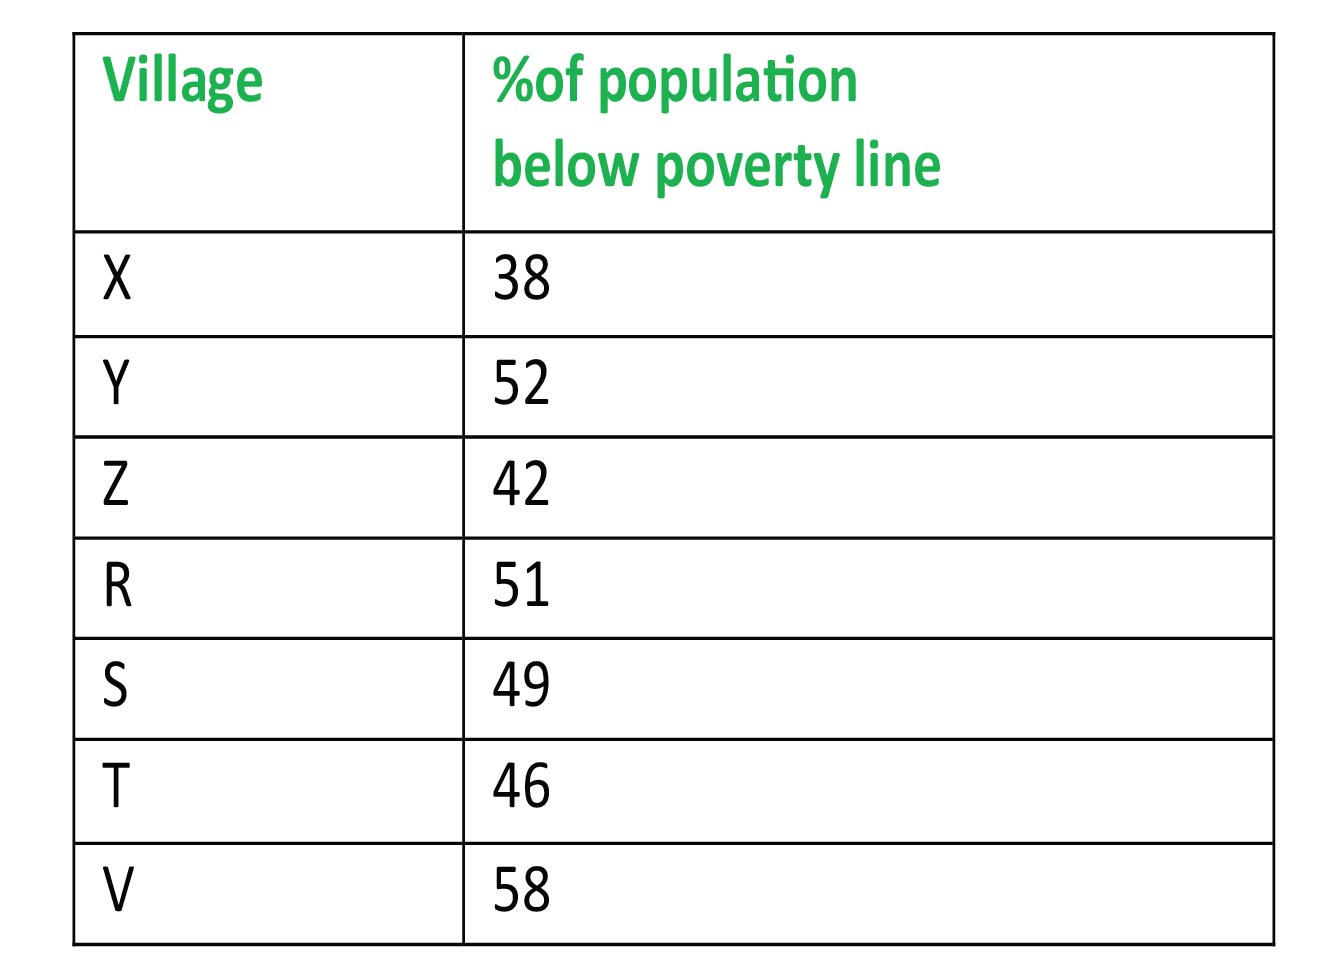
If the below poverty line population of the village 'X' is 12160, then the population of village 'S' is
857 0640876443218fd8d147bda90
640876443218fd8d147bda90- 118500false
- 220500false
- 322000true
- 420000false
- Show AnswerHide Answer
- Workspace
- SingleChoice
Answer : 3. "22000"
Q: In a school of 200 students, the following chart represents the percentage of students involved in different sports.
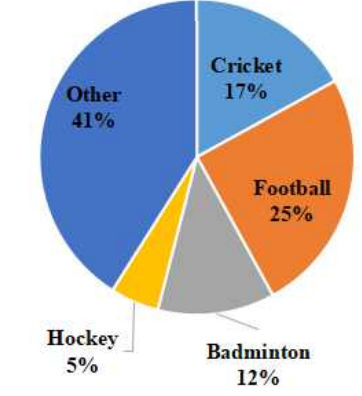
What is the number of students playing cricket?
857 06446675c5bae6d689245fb33
6446675c5bae6d689245fb33- 117false
- 283true
- 324false
- 434false
- Show AnswerHide Answer
- Workspace
- SingleChoice
Answer : 2. "83 "
Q:Directions : The following graph shows production (in thousands) of two types (P and Q) of vehicles by a factory over the years 2009 to 2014. Study the graph and answer the given questions.
In how many of the given years, was the production of Type P vehicles of the company more than the average production of this type vehicles in the given years?
851 063a56c9824e8fb08b9fe1f85
63a56c9824e8fb08b9fe1f85 - 13true
- 24false
- 32false
- 45false
- Show AnswerHide Answer
- Workspace
- SingleChoice
Answer : 1. "3 "
Q:Directions: The following Pie Chart shows the export of different food grains from India in 2010. Study the chart and answer the questions:
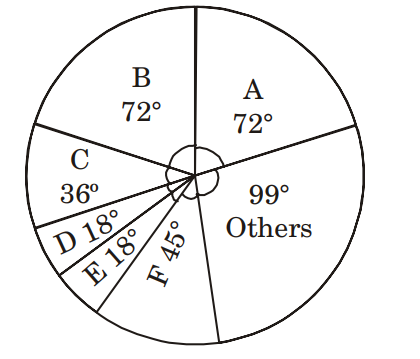
The three crops which combine to contribute to exactly 50% of the total export of food grains are
846 063be6aa71b93047bc20cd365
63be6aa71b93047bc20cd365- 1A, F and othersfalse
- 2B, C and Ffalse
- 3A, B and Ctrue
- 4C, F and othersfalse
- Show AnswerHide Answer
- Workspace
- SingleChoice
Answer : 3. "A, B and C "
Q:Directions: Degree- wise breakup of employees working in various department of an organisation and the ratio to men to women.
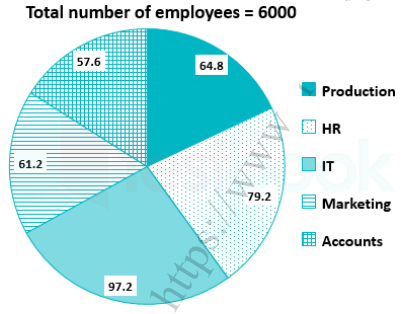
Respective ratio of men to women in each department
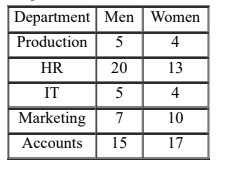
What is the respective ratio of the number of women working in the Marketing department and the number of men working in the Hr department?
840 064da032e462ecdc3adac5f0e
64da032e462ecdc3adac5f0e- 13 : 4true
- 24 : 5false
- 37 : 5false
- 44 : 7false
- 59 : 4false
- Show AnswerHide Answer
- Workspace
- SingleChoice
Answer : 1. "3 : 4"
Q:Directions: The following Pie Chart shows the export of different food grains from India in 2010. Study the chart and answer the questions:
If a total of 1.5 million quintals of crop F was exported, then the total quantity of D and E that was exported (in million quintals) was
839 063be6b4261d62119f1db985c
63be6b4261d62119f1db985c- 11.2true
- 21.5false
- 34.5false
- 46.5false
- Show AnswerHide Answer
- Workspace
- SingleChoice
Answer : 1. "1.2 "
Q:Directions : Read the graph and answer the following questions.
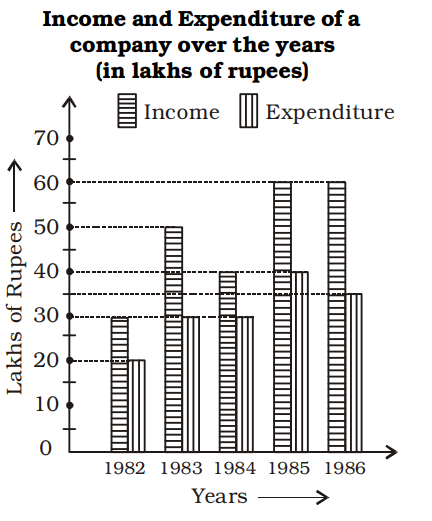
Percentage increase in profit in 1986 over 1982 is
837 06461049b0827e80a9f8acdf9
6461049b0827e80a9f8acdf9- 1150%true
- 2120%false
- 3100%false
- 480%false
- Show AnswerHide Answer
- Workspace
- SingleChoice