Data Interpretation Questions Practice Question and Answer
8 Q:Directions: The bar diagram given below shows the productions (in the unit of thousand pieces) of three types of biscuits by a company in the five consecutive years. Study the diagram and answer the following questions.
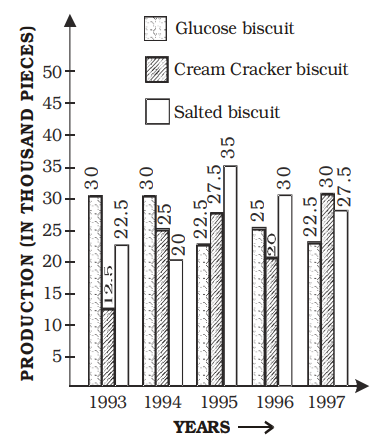
The percentage drop in the number of glucose biscuits manufactured from 1994 to 1995 is
837 064899ea4f4063d472f4a9ec8
64899ea4f4063d472f4a9ec8- 110%false
- 215%false
- 325%true
- 420%false
- Show AnswerHide Answer
- Workspace
- SingleChoice
Answer : 3. "25% "
Q:Directions: The following pie chart show proportion of population of seven villages in 2009. Stud the pie chart and answer question that follows:
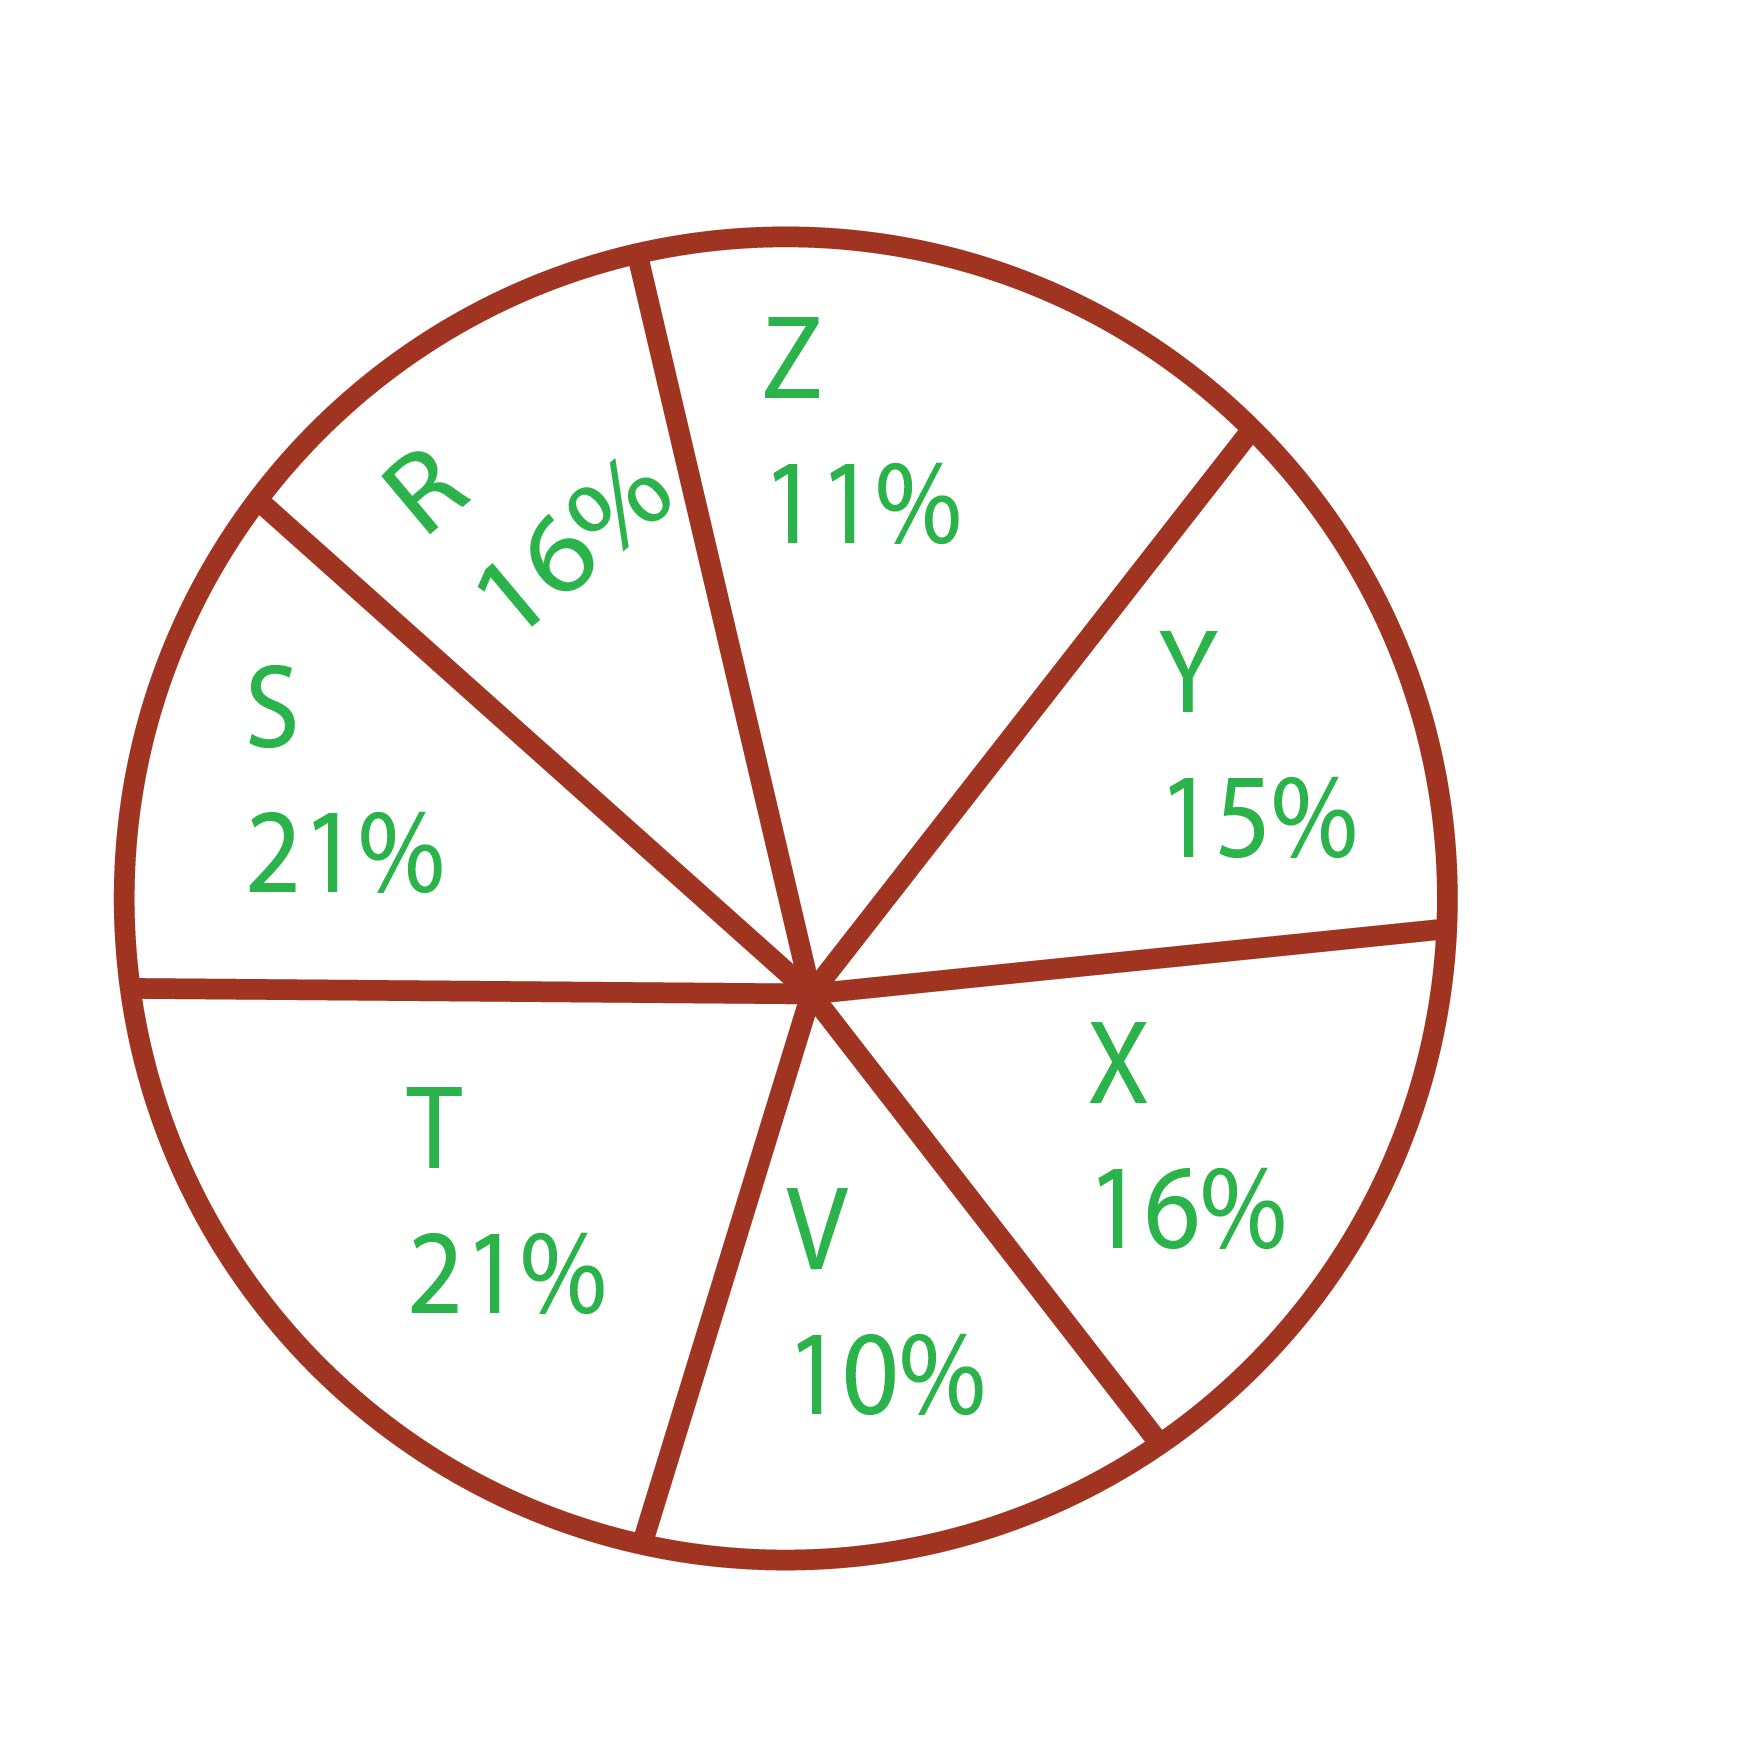
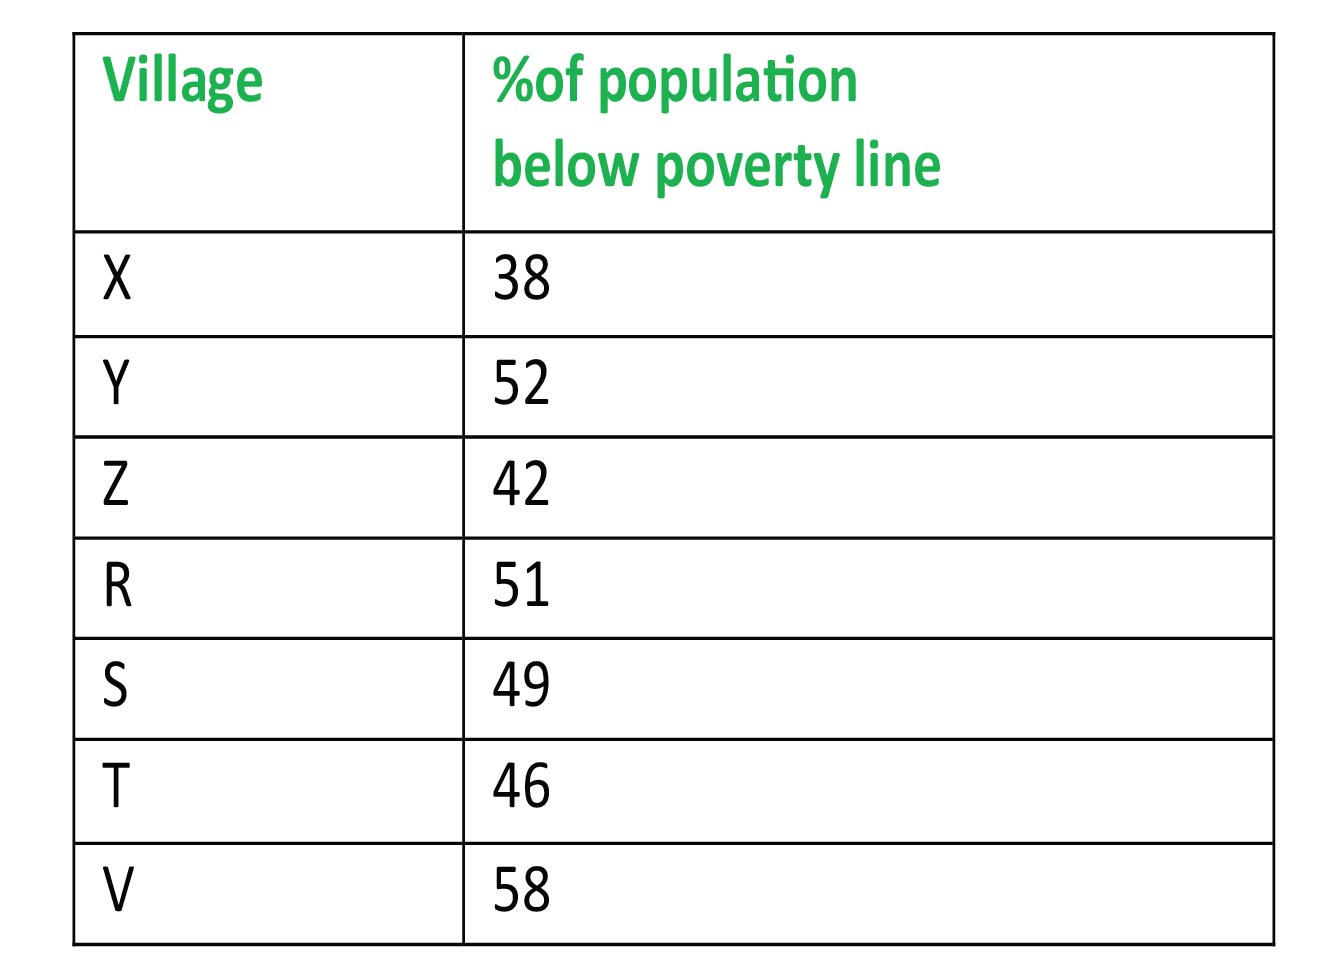
In 2010, the population of 'Y' and 'V' increases by 10% each and the percentage of population below poverty line remains unchanged for all the villages. If in 2009, the population of village Y was 30,000 then the below poverty line population of village 'V' in 2010 is-
834 0640880d7a37bb1a5e16a5bdb
640880d7a37bb1a5e16a5bdb- 111250false
- 212760true
- 313140false
- 413780false
- Show AnswerHide Answer
- Workspace
- SingleChoice
Answer : 2. "12760"
Q:Directions : The Bar Graph given here shows the population (in crores) of India in various census years. Observe the graph and answer the question based on it.
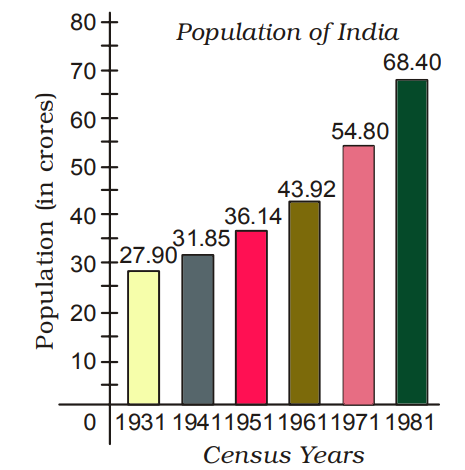
The per cent increase in population from 1971 to 1981 is
832 06453a8987f825208661904d8
6453a8987f825208661904d8- 124.8%true
- 220%false
- 316.7%false
- 422.9%false
- Show AnswerHide Answer
- Workspace
- SingleChoice
Answer : 1. "24.8% "
Q:Directions : Study the following graph and answer the questions.
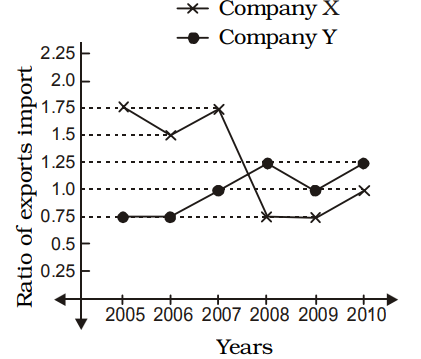
If the imports of company X in 2007 were increased by 40%, what would be the ratio of exports to the increased imports?
829 063a555ecbe1dca1b35d20e06
63a555ecbe1dca1b35d20e06 - 11.25true
- 21.75false
- 30.25false
- 40.75false
- Show AnswerHide Answer
- Workspace
- SingleChoice
Answer : 1. "1.25 "
Q:Direction: Read the following graph carefully and answer the following questions:
The following bar graph shows the quantity(in kg) of wheat, rice, pulses and salts sold by two companies P and Q in the month of January.
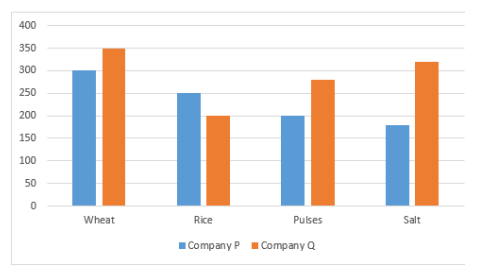
The total quantity of wheat, rice, pulses and salts sold by company P is approximately what percentage more or less than the total quantities sold by company Q?
825 064ddf46580ef1e74b4f17a7c
64ddf46580ef1e74b4f17a7cThe following bar graph shows the quantity(in kg) of wheat, rice, pulses and salts sold by two companies P and Q in the month of January.
- 122% morefalse
- 225% lessfalse
- 315% morefalse
- 412% lessfalse
- 519% moretrue
- Show AnswerHide Answer
- Workspace
- SingleChoice
Answer : 5. "19% more"
Q:Directions : The following graph shows production (in thousands) of two types (P and Q) of vehicles by a factory over the years 2009 to 2014. Study the graph and answer the given questions.
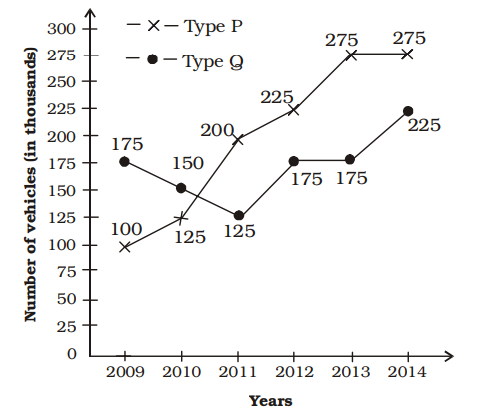
The ratio of total production of Type P vehicles to total production of type Q vehicles over the years is
823 063a56da8b580da5a6237fd52
63a56da8b580da5a6237fd52 - 148 : 41true
- 25 : 8false
- 35 : 8false
- 441 : 48false
- Show AnswerHide Answer
- Workspace
- SingleChoice
Answer : 1. "48 : 41 "
Q:Directions: Student’s strength of a college in Arts, Science and Commerce from 2004-05 to 2007- 08 sessions are shown in the following bar graph. Study the graph and answer the questions
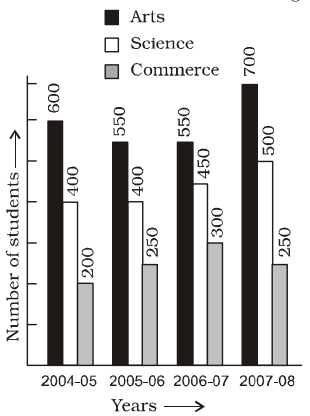
The % increase in science students in 2007-08 over 2006-07 was
822 063f35cc00fa4111f87f087c0
63f35cc00fa4111f87f087c0- 110.1%false
- 211.1%true
- 316.7%false
- 418.2%false
- Show AnswerHide Answer
- Workspace
- SingleChoice
Answer : 2. "11.1% "
Q:Directions : Study the following bar graph and answer the questions.
company (in lakhs of rupees) for the years 1994-1997:
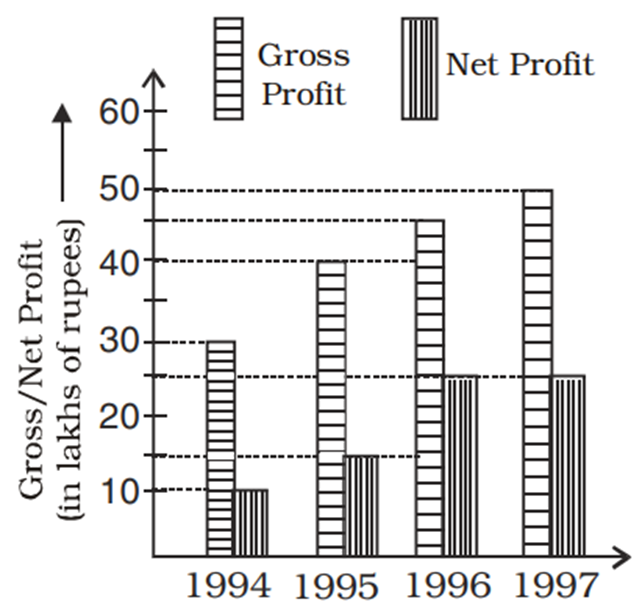
The percentage of net profit of 1995 as compared to the gross profit in that year is
821 06460f549c899b466f4458b03
6460f549c899b466f4458b03- 125.5%false
- 235.5%false
- 337.5%true
- 442.5%false
- Show AnswerHide Answer
- Workspace
- SingleChoice