Data Interpretation Questions Practice Question and Answer
8 Q:Directions: The pie– chart shows the proposed outlay for different sectors during a Five–Year plan of Government of India. Total outlay is Rs. 40,000 crores. By reading the pie–chart answer the following three questions.
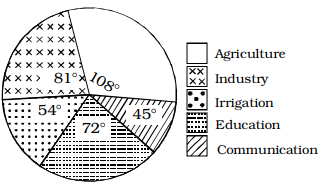
If the proposed outlay of Irrigation is x% of the proposed outlay of Agriculture, then x is equal to
820 06489a4b6f4063d472f4ac0dd
6489a4b6f4063d472f4ac0dd- 150%true
- 215%false
- 325%false
- 475%false
- Show AnswerHide Answer
- Workspace
- SingleChoice
Answer : 1. "50% "
Q:Directions: Degree- wise breakup of employees working in various department of an organisation and the ratio to men to women.
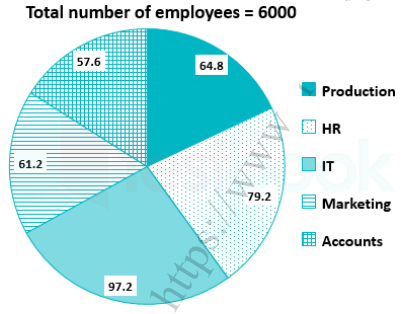
Respective ratio of men to women in each department
The number of women working in the Production department of the Organisation is what percent of the total number of employees working in all the department together?
817 064da0440ebd5c374728ae566
64da0440ebd5c374728ae566- 14%false
- 26%false
- 35%false
- 47%false
- 58%true
- Show AnswerHide Answer
- Workspace
- SingleChoice
Answer : 5. "8%"
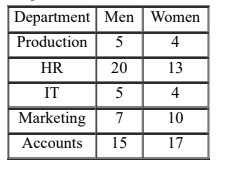
Q:Directions : The Bar Graph given here shows the population (in crores) of India in various census years. Observe the graph and answer the question based on it.
In which census year, the per cent increase in population is highest as compared to that in the previous census year?
815 06453a943613f9f6e3315cfe5
6453a943613f9f6e3315cfe5- 11951false
- 21961false
- 31971false
- 41981true
- Show AnswerHide Answer
- Workspace
- SingleChoice
Answer : 4. "1981 "
Q:Directions: Study the following bar graph carefully to answer the questions.
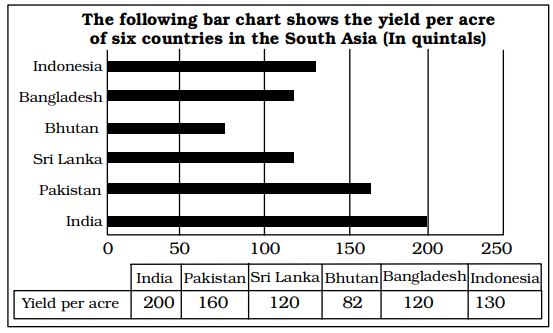
The yield per acre of India is what percent more than that of Pakistan?
814 06464a39c19bbd20a9adaba46
6464a39c19bbd20a9adaba46- 125%true
- 250%false
- 375%false
- 4100%false
- Show AnswerHide Answer
- Workspace
- SingleChoice
Answer : 1. "25% "
Q:Directions : The bar graph, given here, shows the demand and production of colour televisions of five companies for Diwali season in the year 2009. Study the graph carefully and answer the questions based on the graph.
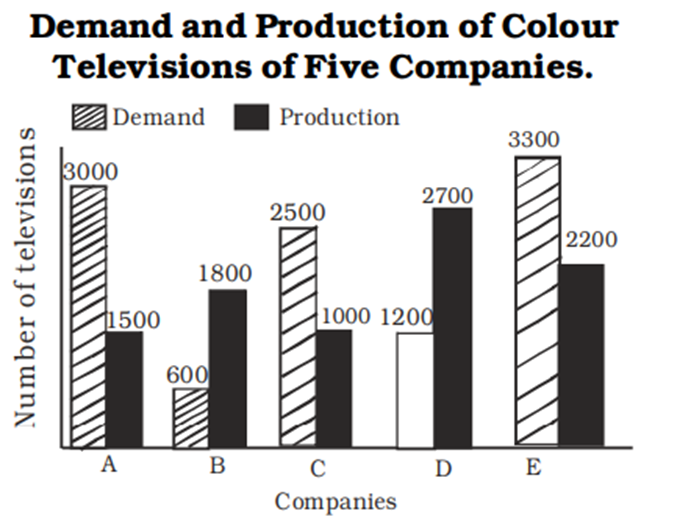
The production of colour televisions of company D is how many times that of company A ?
813 06460fa324f2cce984334e301
6460fa324f2cce984334e301- 11.9false
- 21.8true
- 31.5false
- 42.3false
- Show AnswerHide Answer
- Workspace
- SingleChoice
Answer : 2. "1.8 "
Q:Directions : Study the following pie chart carefully and answer the questions. The pie chart represents the percentage of people involved in various occupations.
Total number of people = 20000
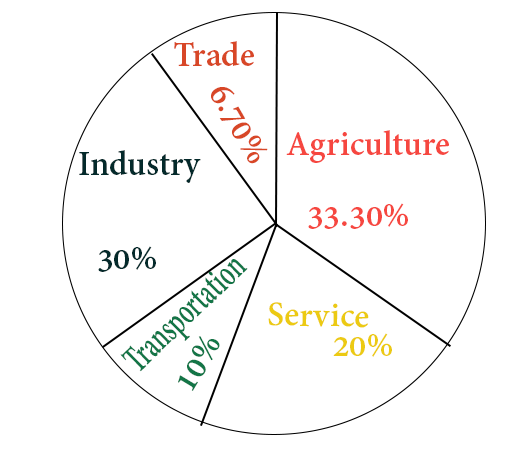
The sectoral angle made by the people involved in service in the given pie-chart is
808 06453a4ef56b58a42369ad85f
6453a4ef56b58a42369ad85fTotal number of people = 20000
- 136°false
- 290°false
- 372°true
- 4108°false
- Show AnswerHide Answer
- Workspace
- SingleChoice
Answer : 3. "72°"
Q:Directions : The bar graph, given here, shows the demand and production of colour televisions of five companies for Diwali season in the year 2009. Study the graph carefully and answer the questions based on the graph.
The demand of colour televisions of company B is appoximately what per cent of that of company C ?
805 06460f985cdae930acb746845
6460f985cdae930acb746845- 160%false
- 225%false
- 324%true
- 46%false
- Show AnswerHide Answer
- Workspace
- SingleChoice
Answer : 3. "24% "
Q:Directions : The bar graph, given here, shows the demand and production of colour televisions of five companies for Diwali season in the year 2009. Study the graph carefully and answer the questions based on the graph.
The ratio of the demand and production of colour televisions of company E is :
804 06460f911f75f230a7a71eb22
6460f911f75f230a7a71eb22- 13 : 2true
- 22 : 3false
- 32 : 1false
- 41 : 2false
- Show AnswerHide Answer
- Workspace
- SingleChoice