Data Interpretation Questions Practice Question and Answer
8 Q:Direction: The line chart given below shows number of labourers (men and women) working in six different years. Study the data carefully and answer the following questions.
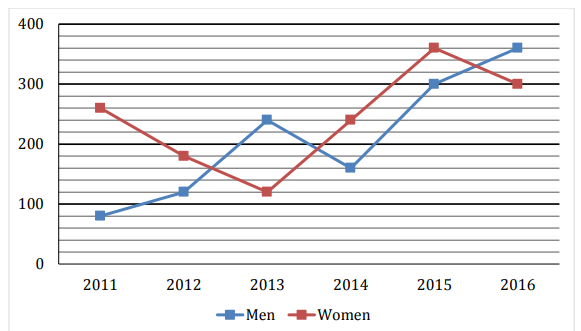
The average number of Women working in 2014, 2015 and 2016 together is how much more/less than average number of Men working in 2011, 2014 and 2016 together?
800 064d4b2f2a798377447221ad1
64d4b2f2a798377447221ad1- 1100true
- 280false
- 390false
- 470false
- 5None of the given optionsfalse
- Show AnswerHide Answer
- Workspace
- SingleChoice
Answer : 1. "100"
Q:Direction: The line chart given below shows number of labourers (men and women) working in six different years. Study the data carefully and answer the following questions.
Find the ratio between total number of Labors working in 2012 and 2013 together to total number of labors working in 2015 and 2016 together.
798 064d4b4859ce88dacc34350c3
64d4b4859ce88dacc34350c3- 12: 1false
- 21: 2true
- 335: 66false
- 411: 10false
- 5None of the given optionsfalse
- Show AnswerHide Answer
- Workspace
- SingleChoice
Answer : 2. "1: 2"
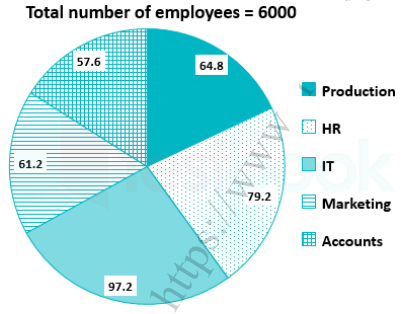
Q:Directions: Degree- wise breakup of employees working in various department of an organisation and the ratio to men to women.
Respective ratio of men to women in each department
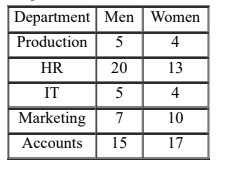
The number of men working in the IT department of the Organisation is approximately what percent of the total number of employees working in that department?
795 064da039fe0ce5574969ee2ab
64da039fe0ce5574969ee2ab- 124%false
- 256%true
- 340%false
- 472%false
- 550%false
- Show AnswerHide Answer
- Workspace
- SingleChoice
Answer : 2. "56%"
Q:Directions: Student’s strength of a college in Arts, Science and Commerce from 2004-05 to 2007- 08 sessions are shown in the following bar graph. Study the graph and answer the questions
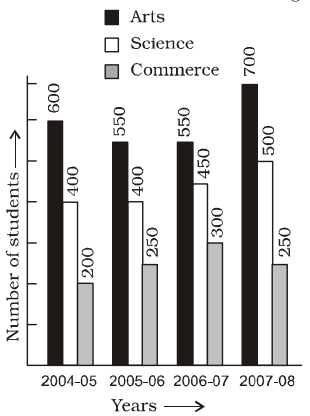
The ratio of average number of students in Arts to the average number of students in Commerce is
792 063f35c75aa2a114c952ed6bb
63f35c75aa2a114c952ed6bb- 112 : 5true
- 210 : 7false
- 37 : 4false
- 448 : 35false
- Show AnswerHide Answer
- Workspace
- SingleChoice
Answer : 1. "12 : 5 "
Q:Direction: Read the following table carefully and answer the following questions: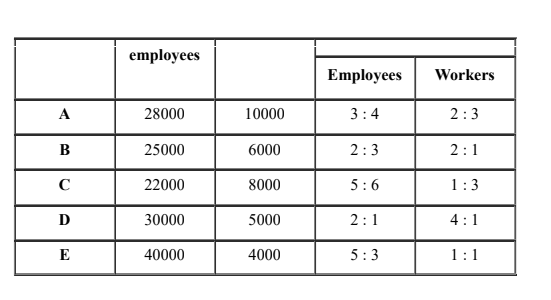
What is the ratio between the number of female workers and female employees of five companies?
787 064d4e3a5d02c5c746bdce983
64d4e3a5d02c5c746bdce983- 11 : 5false
- 21 : 4true
- 32 : 5false
- 41 : 3false
- 52 : 3false
- Show AnswerHide Answer
- Workspace
- SingleChoice
Answer : 2. "1 : 4"
Q:Direction: Read the following table carefully and answer the following questions:
The female workers of five companies are how much percent more than the male workers of five companies?
787 064d4e47da79837744722c13d
64d4e47da79837744722c13d- 13.33%false
- 28.5%false
- 312.5%false
- 46.25%true
- 516.66%false
- Show AnswerHide Answer
- Workspace
- SingleChoice
Answer : 4. "6.25%"
Q:Directions: Following is the pie-chart showing the spending of a family on various items in a particular year
Study the pie chart and answer questions
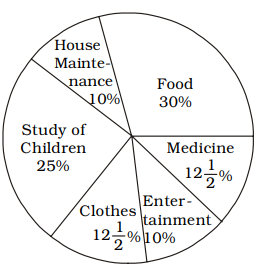
If the total amount spent on the family during the year was ₹ 50,000, how much they spent for buying clothes?
785 063be6f4861d62119f1dbc38c
63be6f4861d62119f1dbc38c- 1₹ 6,250true
- 2₹ 6,500false
- 3₹ 7,250false
- 4₹ 7,500false
- Show AnswerHide Answer
- Workspace
- SingleChoice
Answer : 1. "₹ 6,250 "
Q:Direction: Read the following table carefully and answer the following questions:
Find the average male employees of five companies.
776 064d4e32aebd5c3747278ec73
64d4e32aebd5c3747278ec73- 115600false
- 216400false
- 315400true
- 416600false
- 514400false
- Show AnswerHide Answer
- Workspace
- SingleChoice