Data Interpretation Questions Practice Question and Answer
8 Q:Direction: Given bar graph shows the number of plain books and lined books (in hundreds) available at three different stores and the table shows the percentage of total books (Plain + lined) that was sold by different stores.
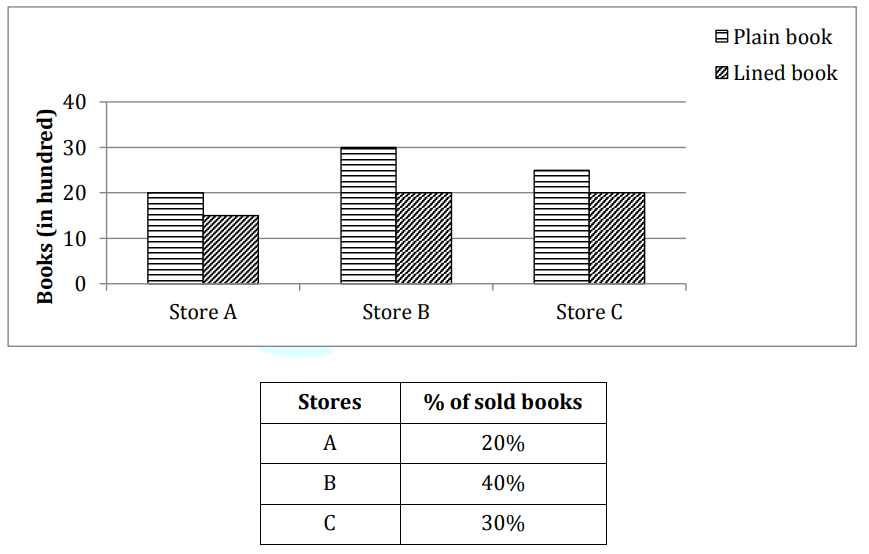
The average of total books sold by stores B and C together is how much more than total unsold books of store A.
2417 0603f3ae1e759ac364c902590
603f3ae1e759ac364c902590- 11055false
- 21175false
- 31125true
- 41075false
- 51225false
- Show AnswerHide Answer
- Workspace
- SingleChoice
Answer : 3. "1125 "
Q:Directions : What will come in the place of the question mark (?) in the following number series?
5040, 840, 168, 42, 14, ? , 7
2413 05e93e5ea3d193e3bf6fdce54
5e93e5ea3d193e3bf6fdce54- 18false
- 29false
- 3None of thesefalse
- 47true
- 53false
- Show AnswerHide Answer
- Workspace
- SingleChoice
Answer : 4. "7"
Q: Direction: The following pie chart shows proportion of the population of seven villages n 2009. Study the pie chart and answer question that follows:
If the following poverty line population of the village ‘X’ is 12160, then the population of village ‘S’ is
 2393 05d7f2728fb24f90208639edd
5d7f2728fb24f90208639edd- 118500false
- 220500false
- 322000true
- 420000false
- Show AnswerHide Answer
- Workspace
- SingleChoice
Answer : 3. "22000"
Q:Directions: Given table shows the data of population in 5 different parks. Study the data carefully and answer the questions.
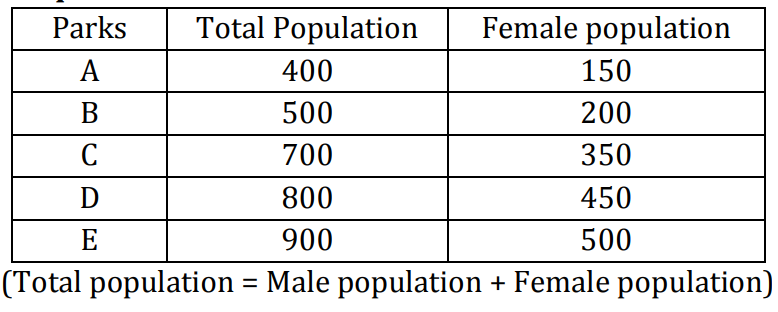
What is average of male population in park B, C and D?
2393 0603f604e56eac5533a8f3af2
603f604e56eac5533a8f3af2- 1343.33false
- 2313.33false
- 3323.33false
- 4333.33true
- 5353.33false
- Show AnswerHide Answer
- Workspace
- SingleChoice
Answer : 4. "333.33"
Q:Direction: The line chart given below shows the number of labors (men and women) working in six different years. Study the data carefully and answer the following questions.
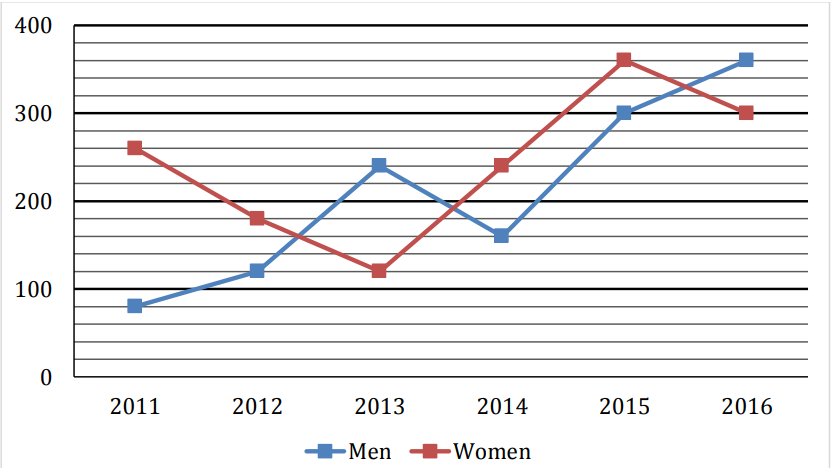
Find the ratio between total number of Labors working in 2012 and 2013 together to total number of labors working in 2015 and 2016 together?
2373 0603dcb36e759ac364c8ba37b
603dcb36e759ac364c8ba37b- 135 : 66false
- 211 : 10false
- 32 : 1false
- 41 : 2true
- 5None of the given optionsfalse
- Show AnswerHide Answer
- Workspace
- SingleChoice
Answer : 4. "1 : 2 "
Q:Direction: Percentage of different types of employees in a company in two consecutive years.
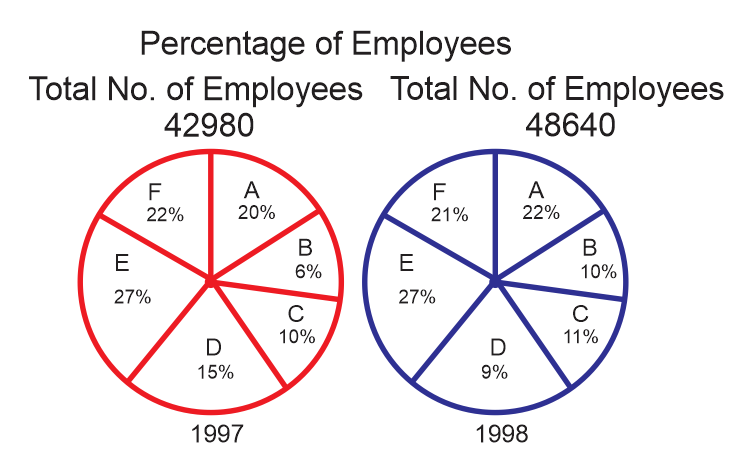
The number of A type employees in 1998 was approximately what percent of the number of A type employees in 1997?
2366 05e32782428cc9f70127707c2
5e32782428cc9f70127707c2- 1125false
- 295false
- 3115true
- 4140false
- Show AnswerHide Answer
- Workspace
- SingleChoice
Answer : 3. "115 "
Q:Directions: Read the following table and answer the questions below it:
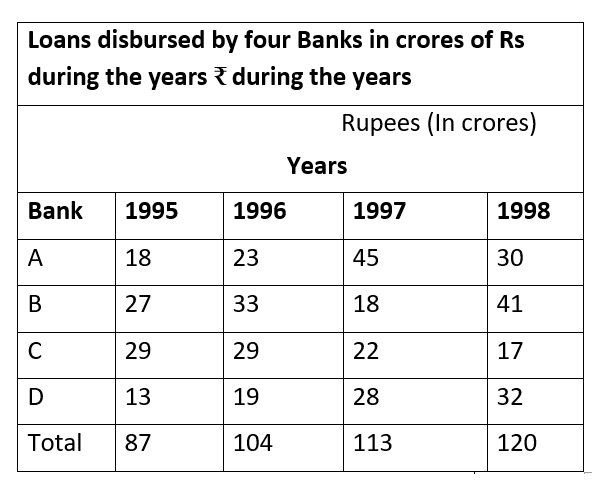
What was the percentage increase of disbursement of loans of all banks together from 1997 to 1998?
2331 05e4e4e561b69e805d0bea340
5e4e4e561b69e805d0bea340- 16 %false
- 2$$6{22\over113}\% $$true
- 3$$6{11\over113}\% $$false
- 4$$7{11\over113}\% $$false
- Show AnswerHide Answer
- Workspace
- SingleChoice
Answer : 2. "$$6{22\over113}\% $$"
Q:Study the table and answer the questions and give answer the following questions.
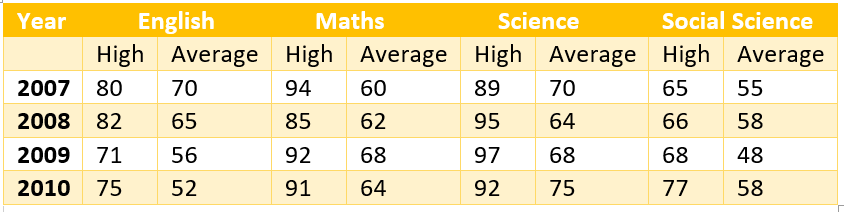
What is the overall average of marks in the four subjects in the year 2009?
2311 05eec856413d72d584fb845ff
5eec856413d72d584fb845ff- 163false
- 265false
- 364false
- 460true
- Show AnswerHide Answer
- Workspace
- SingleChoice