Data Interpretation Questions Practice Question and Answer
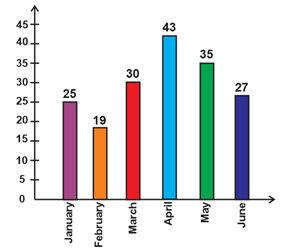
8 Q: Compared to the month of January, what is the percentage of decrease in accidents in the month of February?
2254 05d775f45a1321a5b0b595150
5d775f45a1321a5b0b595150- 125false
- 224true
- 330false
- 427false
- Show AnswerHide Answer
- Workspace
- SingleChoice
Answer : 2. "24"
Q:Direction : Given here is a multiple bar diagram of the scores of four players in two innings. Study the diagram and answer the questions.
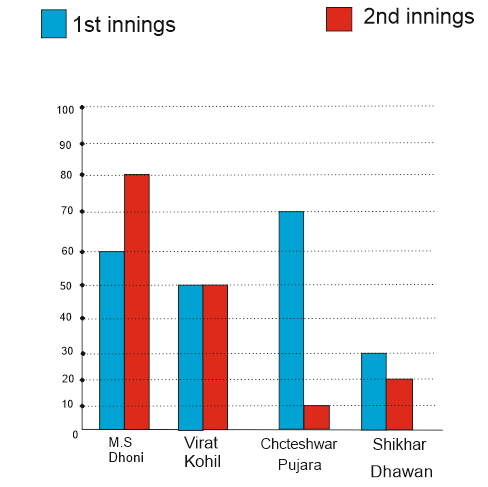
The average runs in two innings of the player who has scored minimum in the second innings are :
2253 05da82f018f123a0cca934e1c
5da82f018f123a0cca934e1c- 130false
- 260false
- 350false
- 440true
- Show AnswerHide Answer
- Workspace
- SingleChoice
Answer : 4. "40 "
Q:Direction: Percentage of different types of employees in a company in two consecutive years.
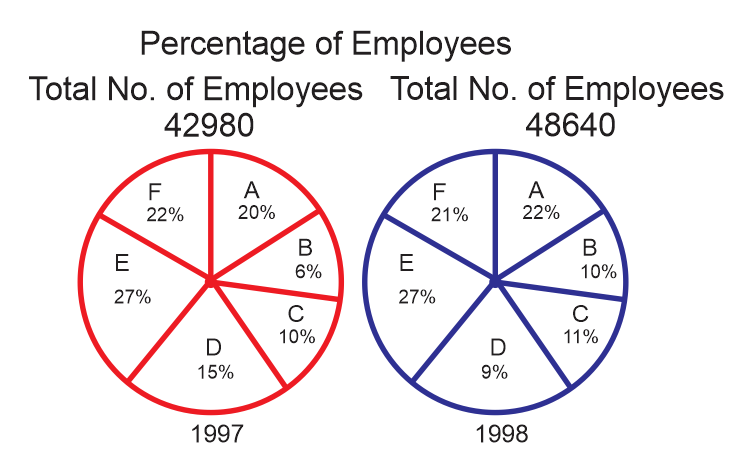
If the number of D type employees in 1998 was 5000. What would have been its approximate percentage in the company?
2242 05e32774fd0aa6f23a8fc64e6
5e32774fd0aa6f23a8fc64e6- 114false
- 210true
- 312false
- 416false
- Show AnswerHide Answer
- Workspace
- SingleChoice
Answer : 2. "10 "
Q:The pie chart below represents the instruments played by students of a school. Read the chart and answer the following questions based on it.
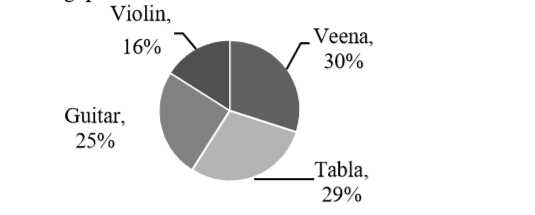
The sector angle corresponding to the Violin is
2225 05eba2f4464cb07648b644e8b
5eba2f4464cb07648b644e8b- 116.8°false
- 216°false
- 357.6°true
- 448°false
- Show AnswerHide Answer
- Workspace
- SingleChoice
Answer : 3. "57.6°"
Q: Percentage of decrease in the number of accidents from May to June is:

2224 05d77610f315eb75b14639bff
5d77610f315eb75b14639bff- 1false

- 2false

- 3false

- 4true

- Show AnswerHide Answer
- Workspace
- SingleChoice
Answer : 4. "
"
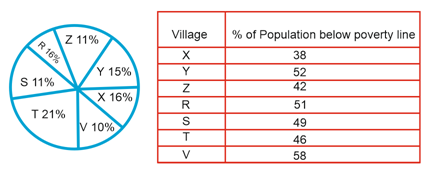
Q: Direction: The following pie chart shows proportion of the population of seven villages n 2009. Study the pie chart and answer question that follows:
If the population of village ‘R’ is 32000, then the below poverty line population of village ‘Y’ is
2216 05d7f28b67f06bc6981e06ecc
5d7f28b67f06bc6981e06eccIf the population of village ‘R’ is 32000, then the below poverty line population of village ‘Y’ is
- 114100false
- 215600true
- 316500false
- 417000false
- Show AnswerHide Answer
- Workspace
- SingleChoice
Answer : 2. "15600"
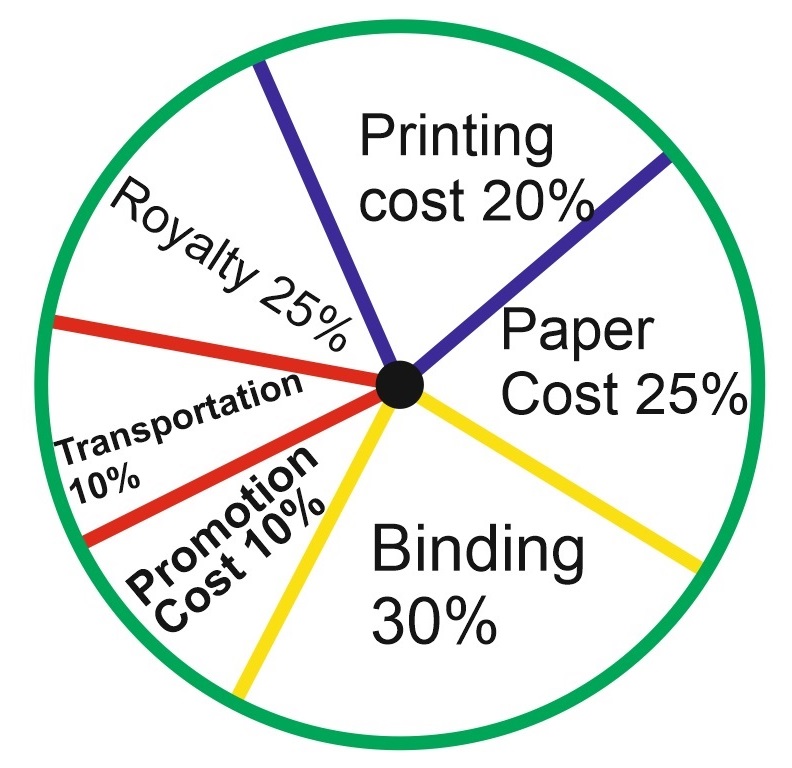
Q: If for a certain quantity of books, the publisher has to pay Rs. 30,600 as printing cost, then what will be the amount of royalty to be paid for these books?
2211 05d70b6cad8eebc768d112b28
5d70b6cad8eebc768d112b28
- 1Rs. 19,450false
- 2Rs. 21,200false
- 3Rs. 22,950true
- 4Rs. 26,150false
- Show AnswerHide Answer
- Workspace
- SingleChoice
Answer : 3. "Rs. 22,950"
Explanation :
Let the amount of Royalty to be paid for these books be Rs. p.
Then, 20 : 15 = 30600 : r ⇒ r = Rs. ![]() = Rs. 22950.
= Rs. 22950.
Q:The circle-graph given here shows the spending of a country on various sports during a particular year. Study the graph carefully and answer the question given below it.
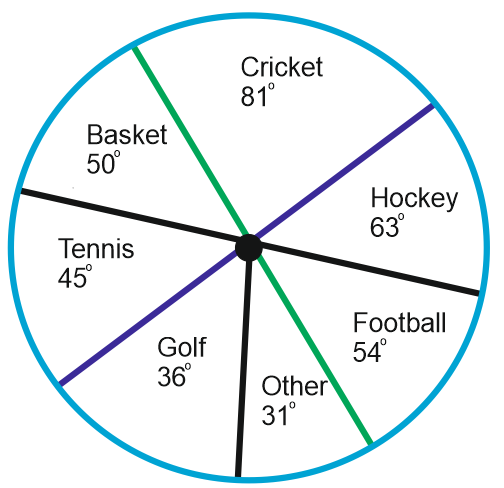
If the total amount spent on sports during the year be Rs. 1,80,00,000 the amount spent on Basketball exceeds that on Tennis by:
2193 05d70b20260d0a53645a46a8f
5d70b20260d0a53645a46a8f
- 1Rs. 2,50,000true
- 2Rs. 3,60,000false
- 3Rs. 3,75,000false
- 4Rs. 4,10,000false
- Show AnswerHide Answer
- Workspace
- SingleChoice