Data Interpretation Questions Practice Question and Answer
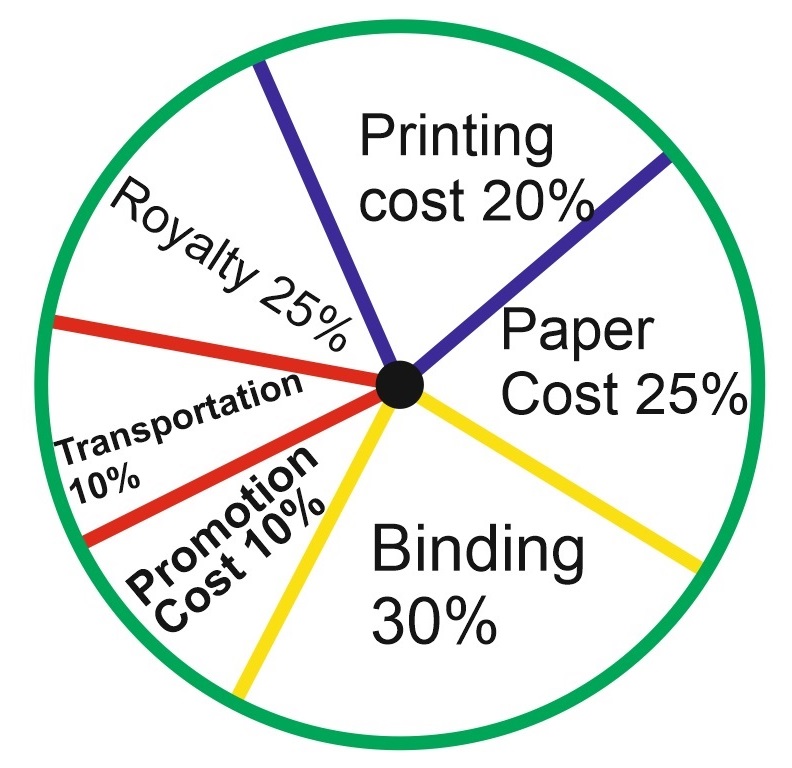
8 Q: The price of the book is marked 20% above the C.P. If the market price of the book is Rs. 180, then what is the cost of the paper used in a single copy of the books?
5746 05d70b8b3eb96471d6f36507a
5d70b8b3eb96471d6f36507a
- 1Rs. 36false
- 2Rs. 37.50true
- 3Rs. 42false
- 4Rs. 44.25false
- Show AnswerHide Answer
- Workspace
- SingleChoice
Answer : 2. "Rs. 37.50"
Explanation :
Clearly, marked price of the book = 120% of C.P
Also, cost of paper = 25% of C.P.
Let the cost of paper for a single book be Rs. n.
Then, 120 : 25 = 180 : n ⇒ n = Rs. ![]() = Rs. 37.50
= Rs. 37.50
Q:Direction: Study the double bar graph given below and answer the questions.
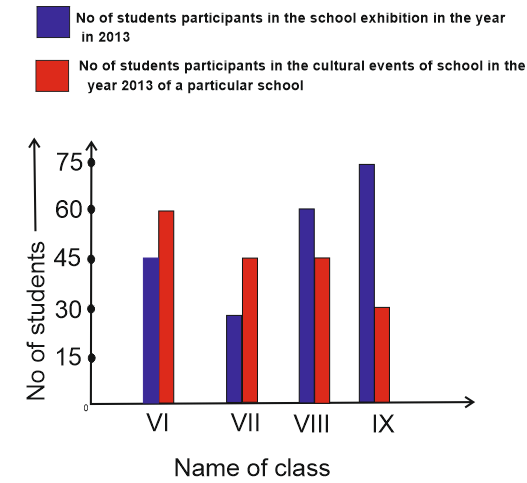
The percentage of students of class VIII participating in cultural event out of total participants of cultural event is
4700 05d93238ac263b979273f36db
5d93238ac263b979273f36db- 130%false
- 225%true
- 335%false
- 440%false
- Show AnswerHide Answer
- Workspace
- SingleChoice
Answer : 2. "25%"
Q:Direction: Given bar graph shows the number of plain books and lined books (in hundreds) available at three different stores and the table shows the percentage of total books (Plain + lined) that was sold by different stores.
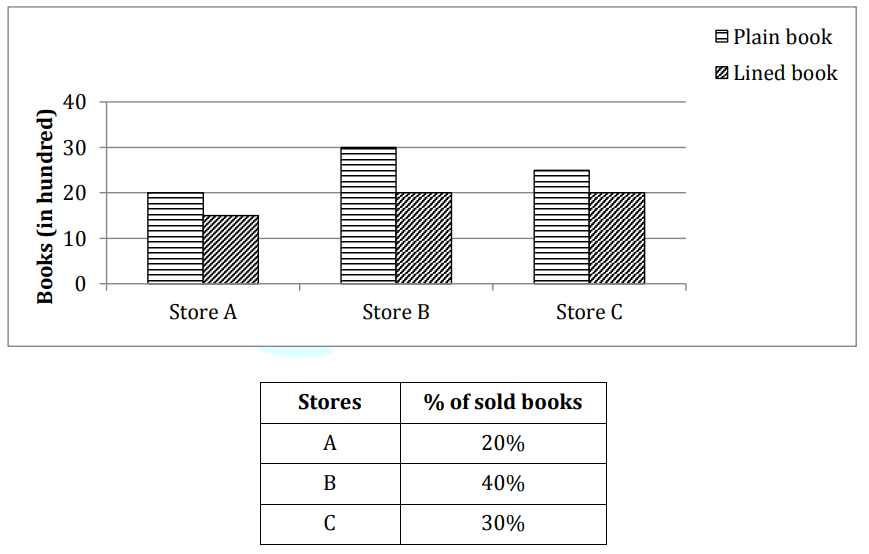
The number of plain books sold by store A and store B was 30% and 40% respectively then find a number of lined books sold by store A and store B together is what percent of total books available at store A?
4633 0603f3a28251bf6540042d090
603f3a28251bf6540042d090- 1$$ 23{4\over 7}\%$$false
- 2$$ 25{5\over 7}\%$$true
- 3$$ 22{6\over 7}\%$$false
- 425%false
- 5None of thesefalse
- Show AnswerHide Answer
- Workspace
- SingleChoice
Answer : 2. "$$ 25{5\over 7}\%$$"
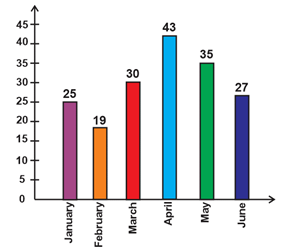
Q: The bar-chart is showing the number of Accidents in a city during the first six month of a year. Examine the bar chart and answer the following questions.
What is the percentage of accidents in the month of April to the total accidents in the city?
4583 05d775e76315eb75b14639a53
5d775e76315eb75b14639a53What is the percentage of accidents in the month of April to the total accidents in the city?
- 115%false
- 220%false
- 322%false
- 424%true
- Show AnswerHide Answer
- Workspace
- SingleChoice
Answer : 4. "24%"
Q:Direction: Study the double bar graph given below and answer the questions.
The ratio of the participants in exhibition of class IX with the total participants of class IX is:
4103 05d9323026819c079458b8139
5d9323026819c079458b8139- 15:7true
- 25:14false
- 31:4false
- 43:5false
- Show AnswerHide Answer
- Workspace
- SingleChoice
Answer : 1. "5:7"
Q:Directions: Given table shows the data of population in 5 different parks. Study the data carefully and answer the questions.
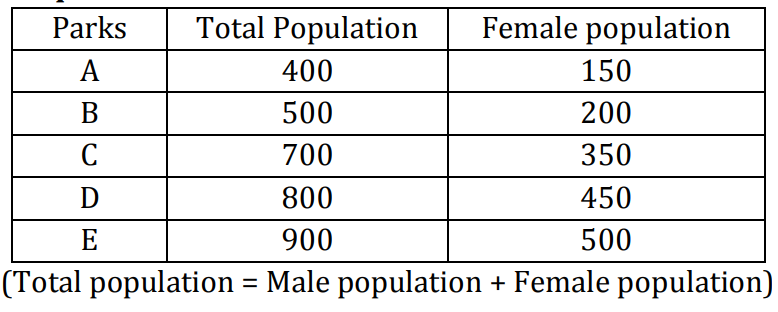
If 20% of total population did not visit on a particular day in park A of which male population was 60% then what percent of total population in park B is male population who visited in park A?
4058 0603f5f4856eac5533a8f3797
603f5f4856eac5533a8f3797- 145%false
- 240.4%true
- 339.2%false
- 448.6%false
- 5None of thesefalse
- Show AnswerHide Answer
- Workspace
- SingleChoice
Answer : 2. "40.4%"
Q:Direction: Study the double bar graph given below and answer the questions.
The average of the number of students participating in exhibition is:
3814 05d932291bc45ad7944d99fa0
5d932291bc45ad7944d99fa0- 148.75false
- 252.5true
- 345false
- 450false
- Show AnswerHide Answer
- Workspace
- SingleChoice
Answer : 2. "52.5"
Q:Direction: The line chart given below shows the number of labors (men and women) working in six different years. Study the data carefully and answer the following questions.
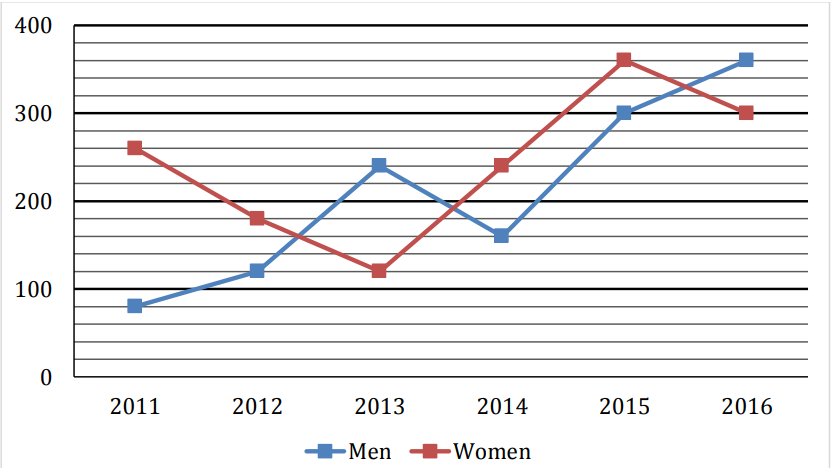
Average number of Women working in 2014, 2015 and 2016 together is how much more/less than average number of Men working in 2011, 2014 and 2016 together?
3718 0603dc6d5e759ac364c8b9e0d
603dc6d5e759ac364c8b9e0d- 190false
- 270false
- 3100true
- 480false
- 5None of the given optionsfalse
- Show AnswerHide Answer
- Workspace
- SingleChoice