Logical Venn Diagrams Questions Practice Question and Answer
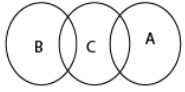
8 Q: Which Venn diagram does the set represent?

1773 05f19532c17ca6a2f066f43c9
5f19532c17ca6a2f066f43c9- 1Water, river, damfalse
- 2India, Mumbai, Delhifalse
- 3State, sea, districtfalse
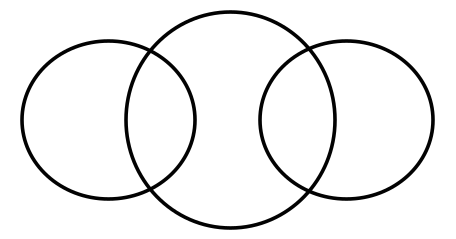
- 4Asia, India, Punetrue
- Show AnswerHide Answer
- Workspace
- SingleChoice
Answer : 4. "Asia, India, Pune"
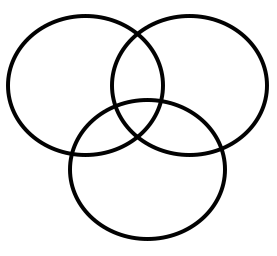
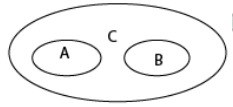
Q: Which of the following groups in the given Venn diagram best represents?
1766 060264ec7473e977f366dc8d8
60264ec7473e977f366dc8d8- 1Principal, Male, Femaletrue
- 2Men, teachers, toolsfalse
- 3Water, salt, sodafalse
- 4Boy, girl, groomfalse
- Show AnswerHide Answer
- Workspace
- SingleChoice
Answer : 1. "Principal, Male, Female"
Q:Direction: Study the following diagram and answer question based on it-
The diagram represents the favourite ice-cream flavours of kids in a society
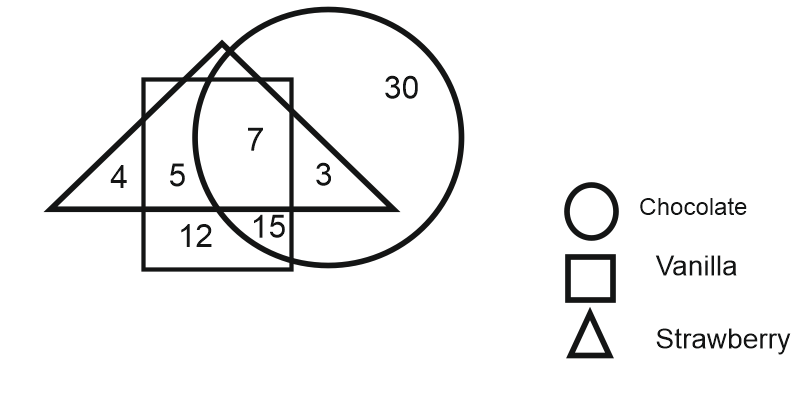
The ratio of kids who like vanilla to those who like chocolate is :
1766 05e7c40269b7cd81e41fae2d8
5e7c40269b7cd81e41fae2d8- 1$$ {12\over30 }$$false
- 2$$ {39\over45 }$$false
- 3$$ {27\over45 }$$false
- 4$$ {39\over55 }$$true
- Show AnswerHide Answer
- Workspace
- SingleChoice
Answer : 4. "$$ {39\over55 }$$"
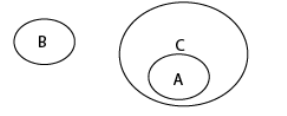
Q: Select the diagram that represents the correct between the squares given below.
District, State, Country
1750 05fa26f83e4a5020b77131db0
5fa26f83e4a5020b77131db0District, State, Country
- 1false
- 2true

- 3false
- 4false
- Show AnswerHide Answer
- Workspace
- SingleChoice
Answer : 2. "
"
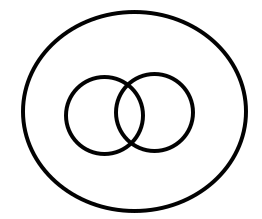
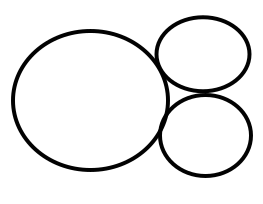
Q: Which of the following correctly represents the relationship between the given classes?
A) Spades
B) Hearts
C) Deck of cards
1750 05fec25c575cddf51b6065ce4
5fec25c575cddf51b6065ce4A) Spades
B) Hearts
C) Deck of cards
- 1true
- 2false
- 3false

- 4false
- Show AnswerHide Answer
- Workspace
- SingleChoice
Answer : 1. "
"
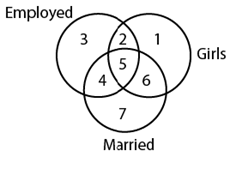
Q: Study the diagram below and identify the region representing girls who are employed but unmarried.
1742 160bdf16705aad558f1cd62a2
60bdf16705aad558f1cd62a2- 12true
- 24false
- 31false
- 45false
- Show AnswerHide Answer
- Workspace
- SingleChoice
Answer : 1. "2"
Q:Study the following diagram and answer questions based on it.
The diagram represents the likes of kids of a class.
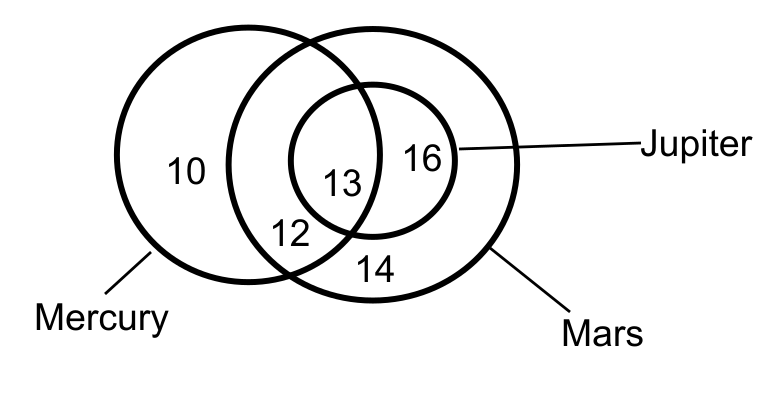
How many people who like Mars like Jupiter also?
1703 0607807acc61d5c2ec94ce801
607807acc61d5c2ec94ce801The diagram represents the likes of kids of a class.
- 145false
- 229true
- 326false
- 413false
- Show AnswerHide Answer
- Workspace
- SingleChoice
Answer : 2. "29"
Q:Study the following diagram and answer questions based on it.
The diagram represents the likes of kids of a class.
What is the difference between the kids who like Mercury and Jupiter?
1671 06078060f0372d8542884540e
6078060f0372d8542884540eThe diagram represents the likes of kids of a class.
- 16true
- 28false
- 310false
- 412false
- Show AnswerHide Answer
- Workspace
- SingleChoice