Logical Venn Diagrams Questions Practice Question and Answer
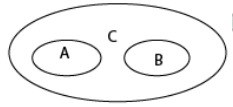
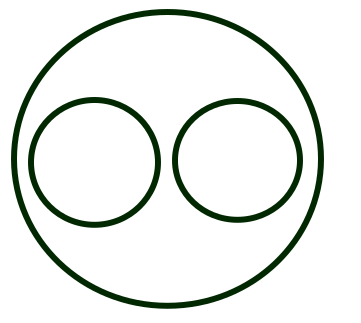
8 Q: Which of the following groups in the given Venn diagram best represents?
1764 060264ec7473e977f366dc8d8
60264ec7473e977f366dc8d8- 1Principal, Male, Femaletrue
- 2Men, teachers, toolsfalse
- 3Water, salt, sodafalse
- 4Boy, girl, groomfalse
- Show AnswerHide Answer
- Workspace
- SingleChoice
Answer : 1. "Principal, Male, Female"
Q: Which of the following diagrams shows the relationship between the award, the Pulitzer award and the Oscar?
1550 0601d1ddb7662e02a751e9a3f
601d1ddb7662e02a751e9a3f- 1false
- 2true

- 3false
- 4false
- Show AnswerHide Answer
- Workspace
- SingleChoice
Answer : 2. "
"
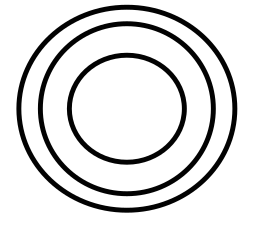
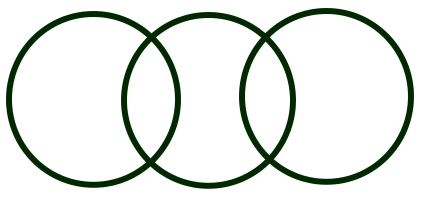
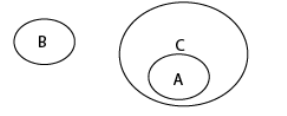
Q: Select the Venn Diagram that best represents the relationship between the following classes.
class, student, teacher
1599 05fc4b8d3a5adbb0808d24b94
5fc4b8d3a5adbb0808d24b94class, student, teacher
- 1false
- 2false
- 3true

- 4false
- Show AnswerHide Answer
- Workspace
- SingleChoice
Answer : 3. "
"
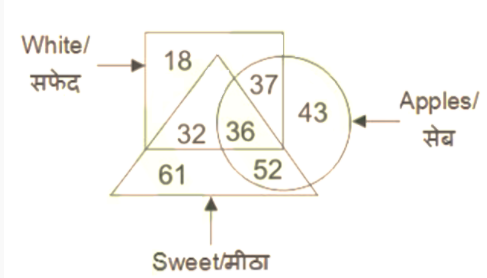
Q: In the given figure, how many white apples are there?
2079 16017e320552e5f41f7a8fad7
6017e320552e5f41f7a8fad7- 137false
- 288false
- 336false
- 473true
- Show AnswerHide Answer
- Workspace
- SingleChoice
Answer : 4. "73"
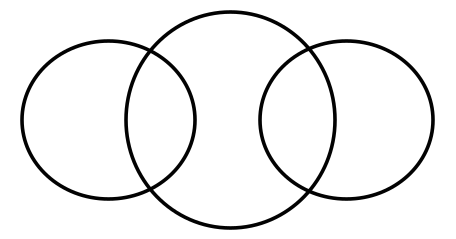
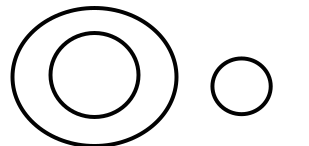
Q: Choose the diagram that correctly represents the relationship between the squares below.
Doctor, man, actor
1539 06017d784556c0d14e2f36f35
6017d784556c0d14e2f36f35Doctor, man, actor
- 1true

- 2false
- 3false
- 4false
- Show AnswerHide Answer
- Workspace
- SingleChoice
Answer : 1. "
"
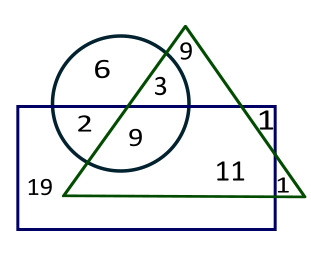
Q: In the given Venn diagram, the ‘circle’ represents ‘ladies’, the ‘triangle’ represents ‘teachers’, and the ‘rectangle’ represents ‘unmarried person’. The numbers given in the diagram represent the number of persons in that particular category.
How many married ladies are teachers?
1463 05ffe992d4426b26e3e593dd3
5ffe992d4426b26e3e593dd3How many married ladies are teachers?
- 111false
- 26false
- 33true
- 49false
- Show AnswerHide Answer
- Workspace
- SingleChoice
Answer : 3. "3"
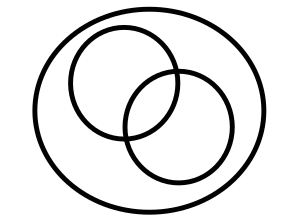
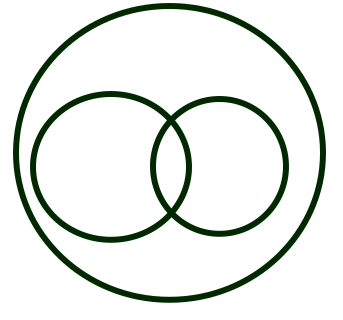
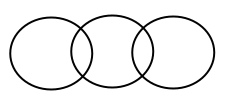
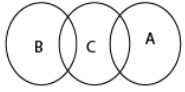
Q: Which of the following correctly represents the relationship between the given classes?
A) Spades
B) Hearts
C) Deck of cards
1750 05fec25c575cddf51b6065ce4
5fec25c575cddf51b6065ce4A) Spades
B) Hearts
C) Deck of cards
- 1true
- 2false
- 3false

- 4false
- Show AnswerHide Answer
- Workspace
- SingleChoice
Answer : 1. "
"
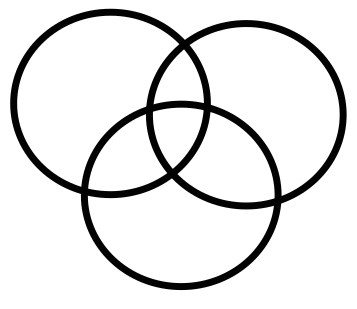
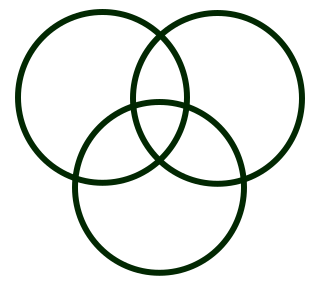
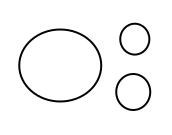
Q: Select the Venn Diagram that best represents the relationship between the following classes.
Male, Doctors, singers
3323 05fc4c02b070eb7152d8121a5
5fc4c02b070eb7152d8121a5Male, Doctors, singers
- 1false

- 2true

- 3false
- 4false

- Show AnswerHide Answer
- Workspace
- SingleChoice
Answer : 2. "
"