Logical Venn Diagrams Questions Practice Question and Answer
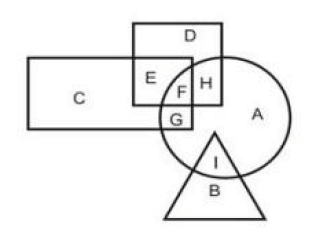
8 Q: In the following figure, the rectangle represents the artists, the triangle represents the writers, the circle represents the social workers and the square represents the father. Which group of letters represents social workers who are not fathers?
2210 05faba796aa6ba574512ae885
5faba796aa6ba574512ae885- 1GFHfalse
- 2IGFfalse
- 3DEBfalse
- 4GAItrue
- Show AnswerHide Answer
- Workspace
- SingleChoice
Answer : 4. "GAI"
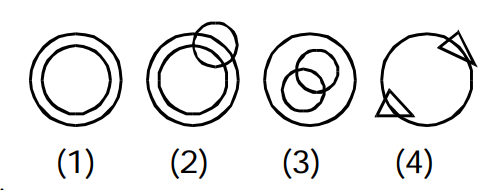
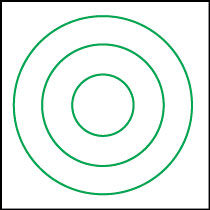
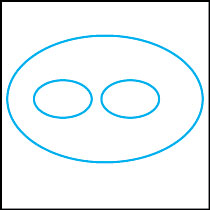
Q:Which one of the following figures represents the statement:
All the persons know English.
Few of them know Hindi also.
Those who know Hindi know Bengali.
2191 06391c8bf58400a550dd7fdb2
6391c8bf58400a550dd7fdb2Few of them know Hindi also.
Those who know Hindi know Bengali.
- 11true
- 22false
- 33false
- 44false
- Show AnswerHide Answer
- Workspace
- SingleChoice
Answer : 1. "1"
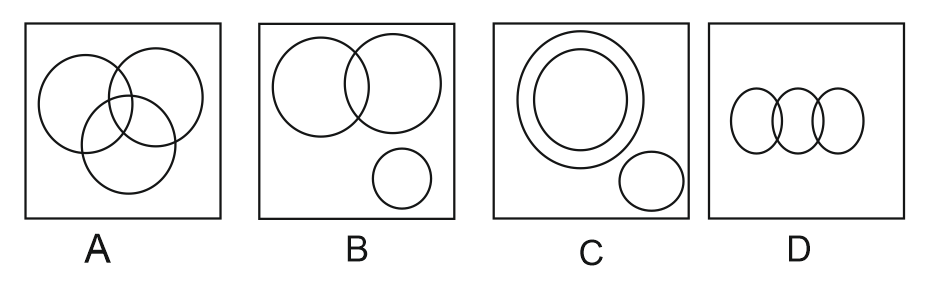
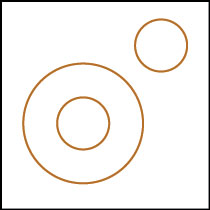
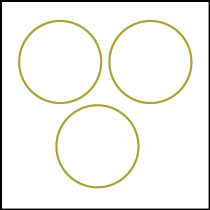
Q: Identify the diagram that best represents the relationship among the given classes.
Vegetable, Park, Carrot
2183 05ed761ca22579c390050f60e
5ed761ca22579c390050f60e- 1Ctrue
- 2Afalse
- 3Bfalse
- 4Dfalse
- Show AnswerHide Answer
- Workspace
- SingleChoice
Answer : 1. "C"
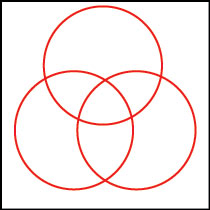
Q:Directions: In each of these questions, three words are related in some way. The relationship among the words in the question can best be represented by one of the five diagrams (a), (b), (c), (d) and (e) given below. Mark your answer accordingly.
Men, Rodents, Living beings
2151 05ee201b92bf4c4044646b76b
5ee201b92bf4c4044646b76b- 1false
- 2false
- 3true
- 4false
- 5false

- Show AnswerHide Answer
- Workspace
- SingleChoice
Answer : 3. "
"
Q:Directions: In each of these questions, three words are related in some way. The relationship among the words in the question can best be represented by one of the five diagrams (a), (b), (c), (d) and (e) given below. Mark your answer accordingly.
Teacher, College, Student
2112 05ec7cad2112c8637e1b4f9be
5ec7cad2112c8637e1b4f9be- 1false

- 2false

- 3true

- 4false

- 5false
- Show AnswerHide Answer
- Workspace
- SingleChoice
Answer : 3. "
"
Q:Study the following figure and answer the following questions.
1. Here the big triangle shows the artists.
2.Short represents triangular scientists.
3. The square refers to dancers.
4.The Circle refers to the doctors.
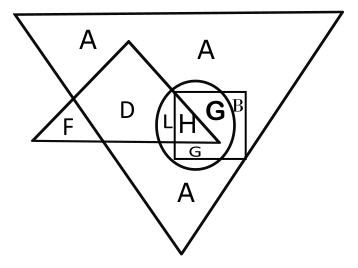
Which letter represents artists who are neither doctors, nor scientists nor dancers?
2092 05f3cc69e069d3f5fd51d0248
5f3cc69e069d3f5fd51d0248- 1Dfalse
- 2Ffalse
- 3Atrue
- 4Gfalse
- Show AnswerHide Answer
- Workspace
- SingleChoice
Answer : 3. "A"
Q:Study the diagram given below and answer each of the following questions.
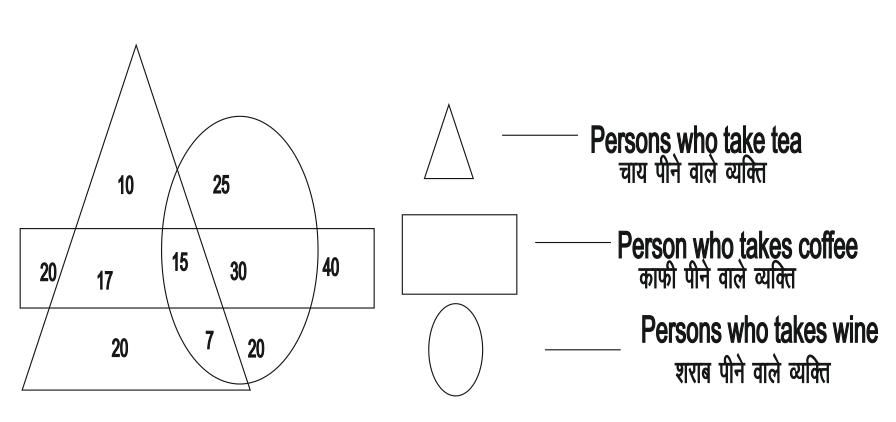
How many persons take wine?
2080 05eec55baeee45c3b837ed05d
5eec55baeee45c3b837ed05d- 1100false
- 282false
- 392false
- 4122true
- Show AnswerHide Answer
- Workspace
- SingleChoice
Answer : 4. "122"
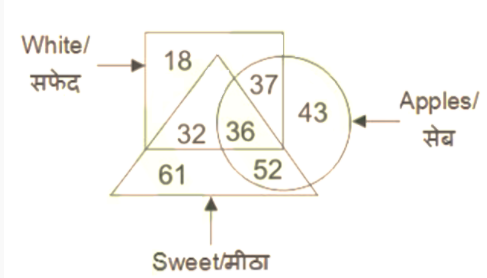
Q: In the given figure, how many white apples are there?
2079 16017e320552e5f41f7a8fad7
6017e320552e5f41f7a8fad7- 137false
- 288false
- 336false
- 473true
- Show AnswerHide Answer
- Workspace
- SingleChoice