Data Interpretation Practice Question and Answer
8 Q:The circle-graph given here shows the spending of a country on various sports during a particular year. Study the graph carefully and answer the question given below it.
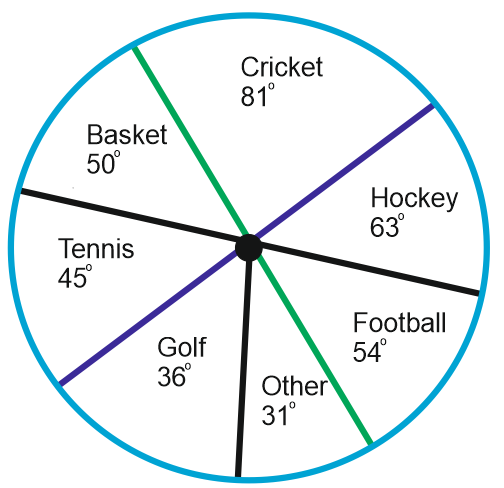
If the total amount spent on sports during the year be Rs. 1,80,00,000 the amount spent on Basketball exceeds that on Tennis by:
2193 05d70b20260d0a53645a46a8f
5d70b20260d0a53645a46a8f
- 1Rs. 2,50,000true
- 2Rs. 3,60,000false
- 3Rs. 3,75,000false
- 4Rs. 4,10,000false
- Show AnswerHide Answer
- Workspace
- SingleChoice
Answer : 1. "Rs. 2,50,000"
Q:The following line graph gives the percentage of the number of candidates who qualified an examination out of the total number of candidates who appeared for the examination over a period of seven years from 1994 to 2000.
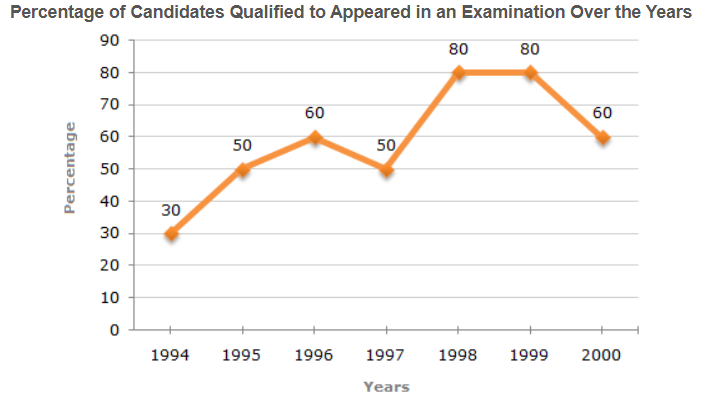
If the number of candidates qualified in 1998 was 21200, what was the number of candidates appeared in 1998?
2192 05e799a058560ba13b0273678
5e799a058560ba13b0273678- 132000false
- 228500false
- 326500true
- 425000false
- 5None of thesefalse
- Show AnswerHide Answer
- Workspace
- SingleChoice
Answer : 3. "26500"
Q:The following line graph gives the percentage of the number of candidates who qualified an examination out of the total number of candidates who appeared for the examination over a period of seven years from 1994 to 2000.
In which pair of years was the number of candidates qualified, the same?
2192 05e799982c59e560304b98b59
5e799982c59e560304b98b59- 11995 and 1997false
- 21995 and 2000false
- 31998 and 1999false
- 4Data inadequatetrue
- 5None of thesefalse
- Show AnswerHide Answer
- Workspace
- SingleChoice
Answer : 4. "Data inadequate"
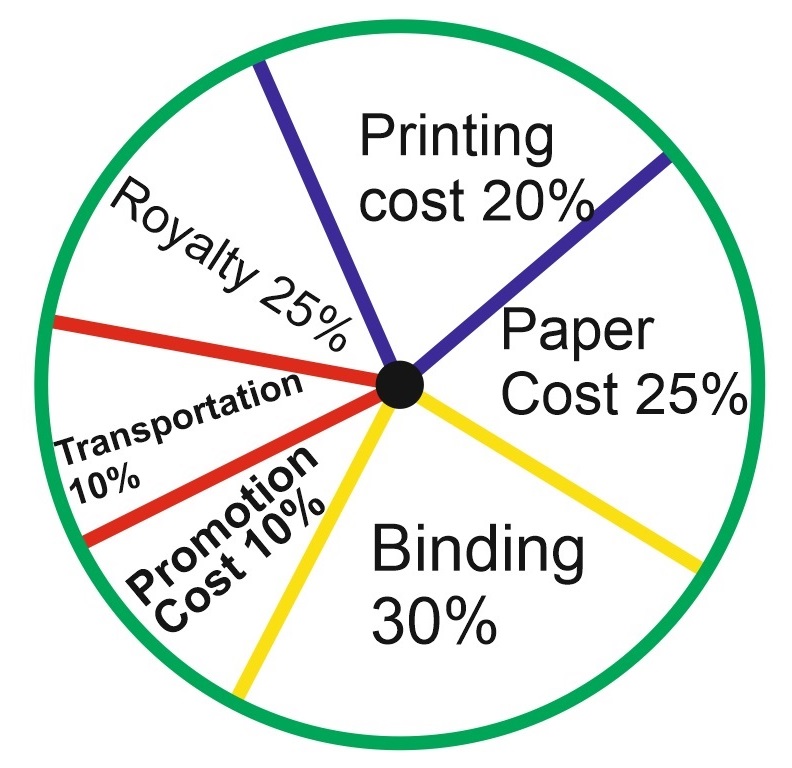
Q: For an edition of 12,500 copies, the amount of Royalty paid by the publisher is Rs. 2,18,250. What should be the selling price of the book if the publisher desires a profit of 5%?
2167 05d70c47160d0a53645a479a0
5d70c47160d0a53645a479a0
- 1Rs. 152.50false
- 2Rs. 157.50true
- 3Rs. 162.50false
- 4Rs. 167.50false
- Show AnswerHide Answer
- Workspace
- SingleChoice
Answer : 2. "Rs. 157.50"
Explanation :
Clearly, S.P. of the book = 105% of C.P.
Let the selling price of this edition (of 12500 books) be Rs. x.
Then, 15 : 105 = 281250 : x ⇒ x = Rs. ![]() = Rs. 1968750.
= Rs. 1968750.
⸫ S.P of one book = Rs. ![]() = Rs. 157.50
= Rs. 157.50
Q:Directions: The Bar Graph given here shows the population (in crores) of India in various census years. Observe the graph and answer the question based on it.
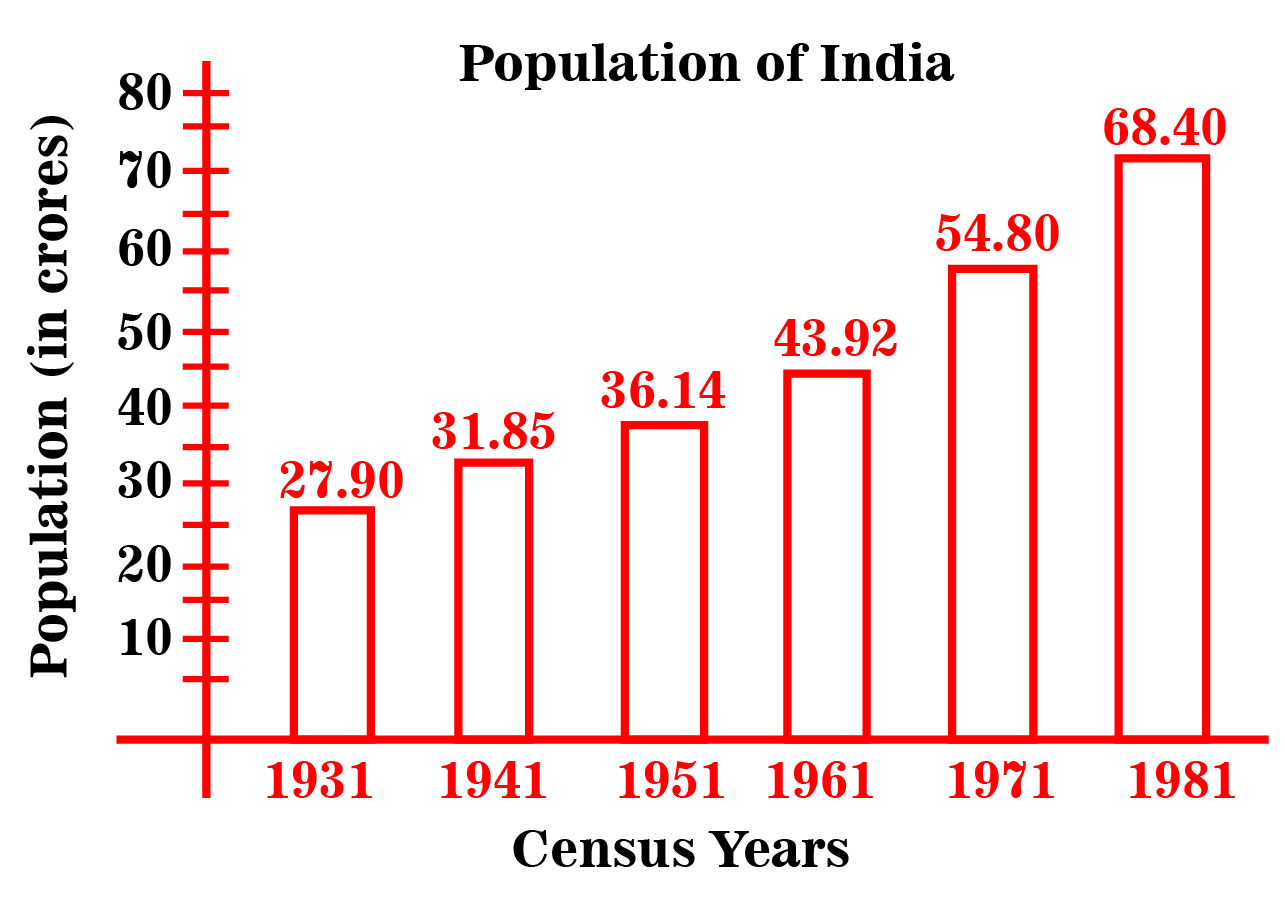
The percent increase in population from 1971 to 1981 is
2161 05ea80f5a14fb314c31fe1183
5ea80f5a14fb314c31fe1183- 124.8%true
- 220%false
- 316.7%false
- 422.9 %false
- 5None of thesefalse
- Show AnswerHide Answer
- Workspace
- SingleChoice
Answer : 1. "24.8% "
Q:A bar graph showing the height of six mountain peaks. Study the bar graph and answer the following Questions.
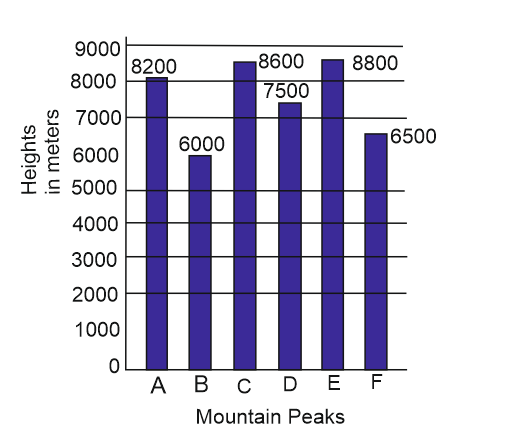
The average height of all the peak (in meters) is
2157 05f06deffb13c2d244adaaeee
5f06deffb13c2d244adaaeee- 17600true
- 27601.5false
- 37599.5false
- 47610false
- Show AnswerHide Answer
- Workspace
- SingleChoice
Answer : 1. "7600"
Q:Directions: The following pie-chart represents the result of 600 successful students in various subject of an examination. Study the Pie-chart and answer question.
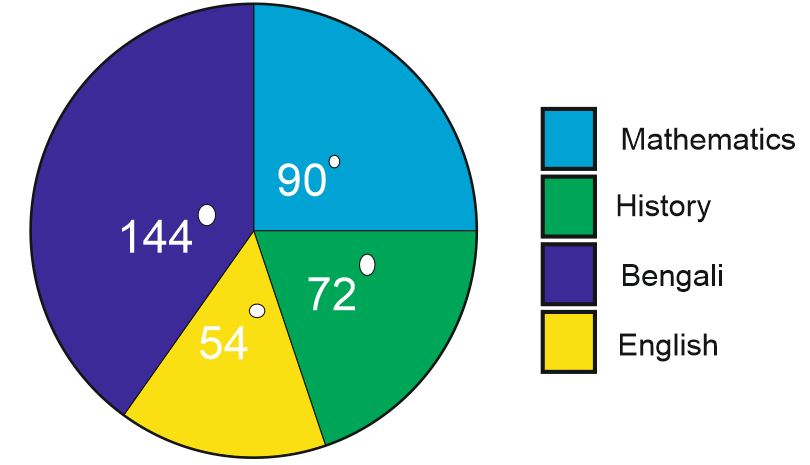
The number of students who passed in Bengali is –
2155 05ee30248e9ea010382e7e3d2
5ee30248e9ea010382e7e3d2- 1240true
- 2320false
- 3180false
- 4140false
- Show AnswerHide Answer
- Workspace
- SingleChoice
Answer : 1. "240"
Q:Direction : Given here is a multiple bar diagram of the scores of four players in two innings. Study the diagram and answer the questions.
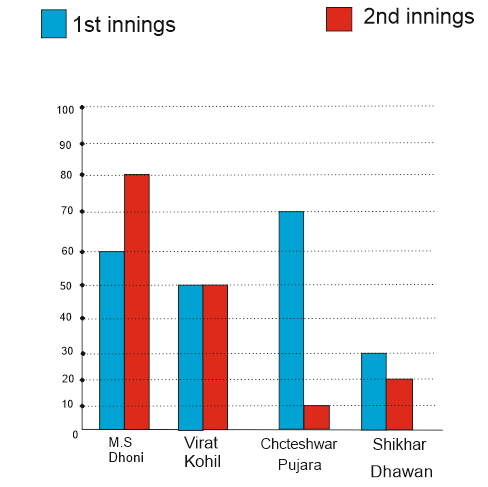
The average runs of two innings of the player who scored highest in average are :
2124 05da82e7ab247ec0cc95f2a93
5da82e7ab247ec0cc95f2a93- 170true
- 280false
- 385false
- 475false
- Show AnswerHide Answer
- Workspace
- SingleChoice