Data Interpretation Practice Question and Answer
8 Q:Study the table and answer the questions and give answer the following questions.
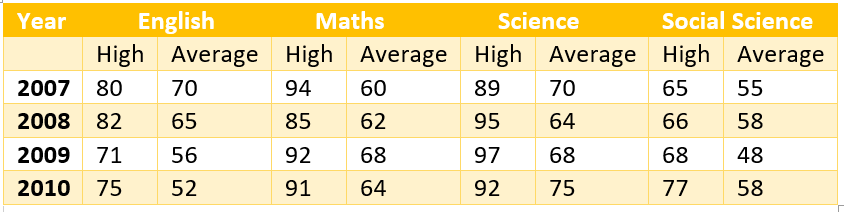
In which year , the difference between the highest and the average marks in maths was maximum?
2115 05eec8745985769334140bd68
5eec8745985769334140bd68- 12007false
- 22009false
- 32008true
- 42010false
- Show AnswerHide Answer
- Workspace
- SingleChoice
Answer : 3. "2008"
Q: A sum of money is to be divided among four persons in the ratio of 2:3:4:5. Out of the four, one person gets Rs. 200 more than the other and Rs.100 less than another. What is the sum?
2103 05da404037919e54a8e3d2899
5da404037919e54a8e3d2899- 1Rs 2800false
- 2Rs 1400false
- 3Rs 4200false
- 4Cannot be determinedtrue
- 5None of thesefalse
- Show AnswerHide Answer
- Workspace
- SingleChoice
Answer : 4. "Cannot be determined"
Q:Direction: Study the pie chart carefully and answer the given questions. The pie chart shows the percentage breakup of students in different classes from VI to X in the year 2017
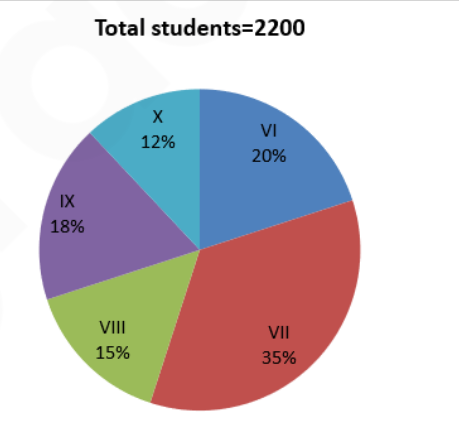
The total number of students study in class VI and class IX together is approximate what percentage more than that of the total number of students study in class X?
2090 060a256afb1d2440614b9fabb
60a256afb1d2440614b9fabb- 1189%false
- 277%false
- 3125%false
- 4280%false
- 5217%true
- Show AnswerHide Answer
- Workspace
- SingleChoice
Answer : 5. "217%"
Q:Directions: The bar graph given below shows the spending of family income on various items and savings during 1993. Observe the graph and answer the following questions:
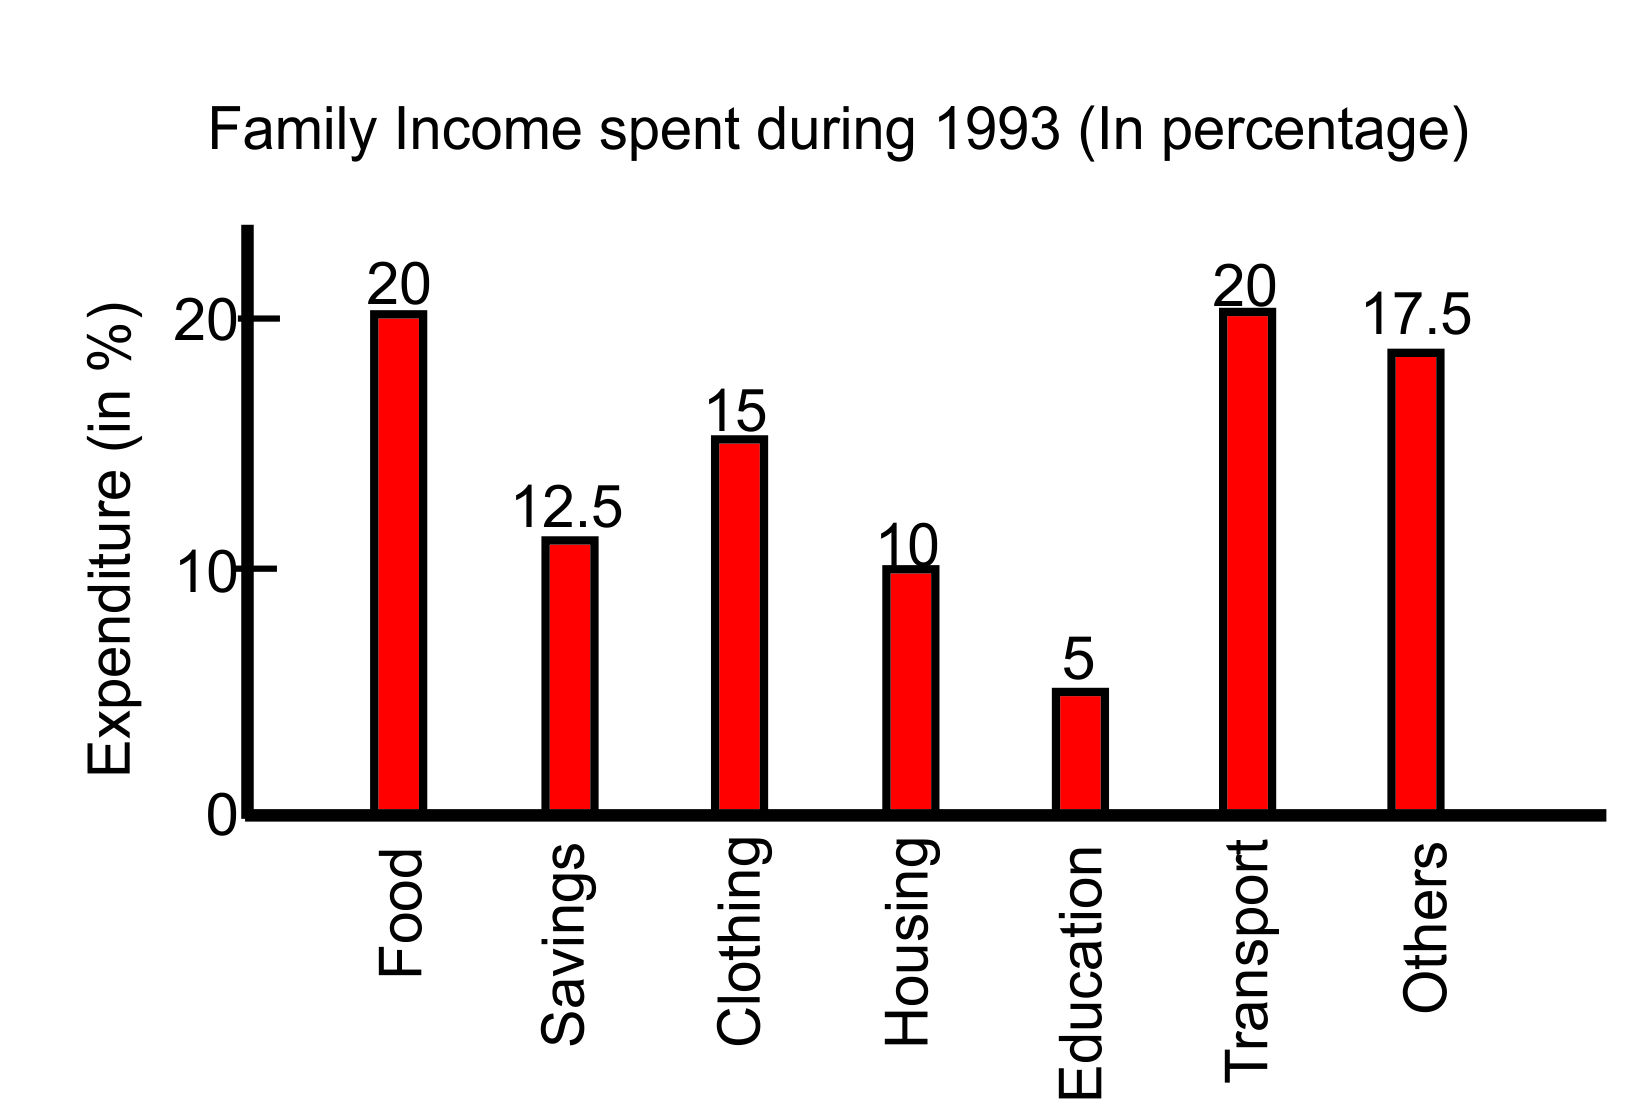
The savings of the family is more than that of expenditure incurred on:
2084 05def3f82806c5b05d54f26b3
5def3f82806c5b05d54f26b3- 1housingtrue
- 2clothingfalse
- 3transportfalse
- 4othersfalse
- Show AnswerHide Answer
- Workspace
- SingleChoice
Answer : 1. "housing "
Q:Direction: Given bar graph shows the number of plain books and lined books (in hundreds) available at three different stores and the table shows the percentage of total books (Plain + lined) that was sold by different stores.
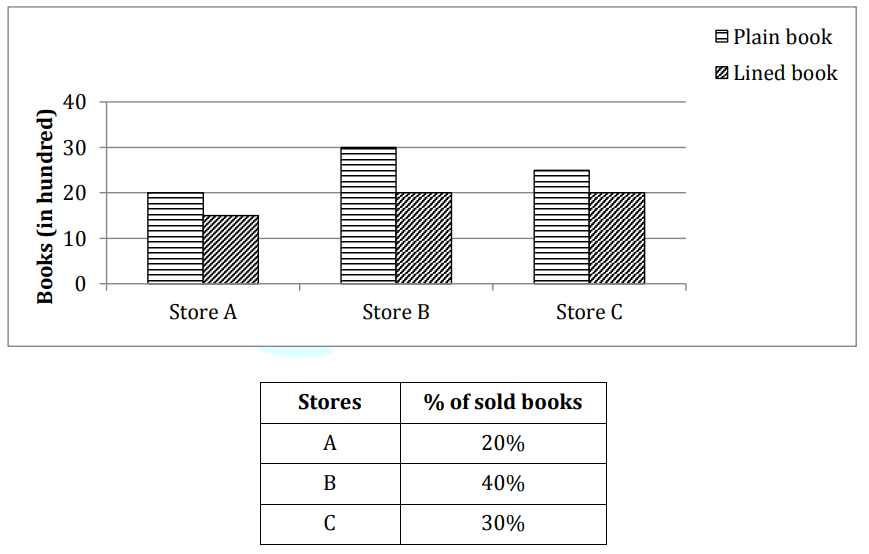
Unsold books of store A is approximately is what percent more or less than total unsold books of store B and C together.
2070 0603f3cefe759ac364c902aee
603f3cefe759ac364c902aee- 159%false
- 252%false
- 348%false
- 454%true
- 557%false
- Show AnswerHide Answer
- Workspace
- SingleChoice
Answer : 4. "54% "
Q:Direction (94-98): Study the following table to answer the given questions.
Centre and Post-wise Numbered of candidate
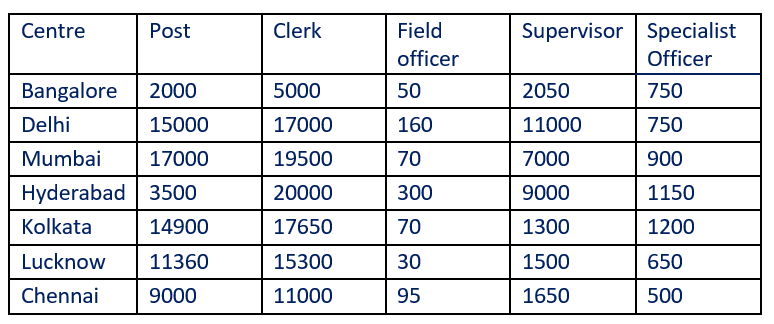
Which centre has the highest number of candidates?
2066 05da400f4d69109270473a035
5da400f4d69109270473a035Centre and Post-wise Numbered of candidate
- 1Delhifalse
- 2Kolkatafalse
- 3Hyderabadfalse
- 4Mumbaitrue
- 5None of thesefalse
- Show AnswerHide Answer
- Workspace
- SingleChoice
Answer : 4. "Mumbai"
Q:Study the table and answer the questions and give answer the following questions.
Supposing that there were 40 students in sciences in the year 2009. How much total of marks did they receive combined together?
2057 05eec85e6eee45c3b837fa9ef
5eec85e6eee45c3b837fa9ef- 12800false
- 22720true
- 32560false
- 43000false
- Show AnswerHide Answer
- Workspace
- SingleChoice
Answer : 2. "2720"
Q:The circle-graph given here shows the spending of a country on various sports during a particular year. Study the graph carefully and answer the question given below it.
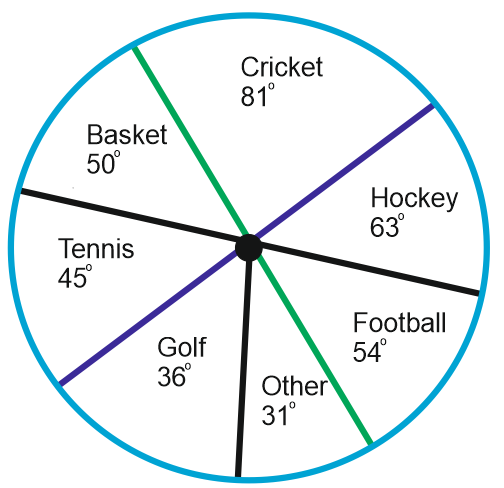
If the total amount spent on sports during the year was Rs. 2 crores, the amount spent on cricket and Hockey together was:
2051 05d70afe4eb96471d6f364689
5d70afe4eb96471d6f364689
- 1Rs. 8,00,000false
- 2Rs. 80,00,000true
- 3Rs. 1,20,00,000false
- 4Rs. 1,60,00,000false
- Show AnswerHide Answer
- Workspace
- SingleChoice