Data Interpretation Practice Question and Answer
8 Q:Directions: The following bar graph shows the percentage breakup of a Sunil’s salary from year 2012 to 2016. With the given information, find the following questions.
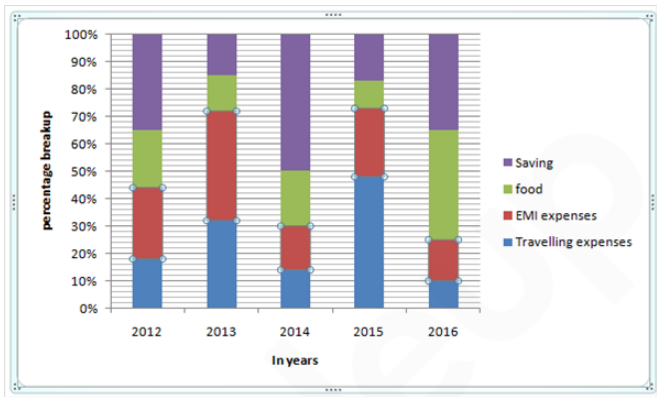
Every year there is an increase of 100% in monthly salary as compared to previous year’s monthly salary then what is the ratio of monthly salary in 2016 to the expenses on travelling in 2013.
1935 060a23bac3c86b05632618f76
60a23bac3c86b05632618f76- 180:3false
- 225:1true
- 38:1false
- 41:25false
- 5None of thesefalse
- Show AnswerHide Answer
- Workspace
- SingleChoice
Answer : 2. "25:1"
Q:Study the following bar chart and answer the questions carefully.
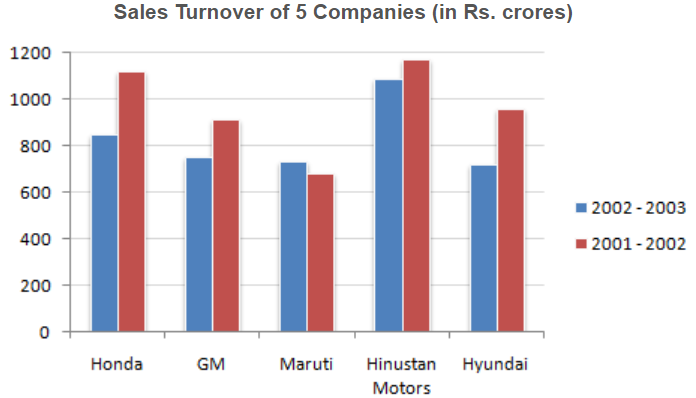
What is the absolute change in overall sales turnover of the five companies together between 2001 - 2002 and 2002 - 2003 ?
1931 05fd33b3cc46a213fc5c4fc25
5fd33b3cc46a213fc5c4fc25- 1712.43true
- 2142.48false
- 3683.53false
- 4655.56false
- 5None of thesefalse
- Show AnswerHide Answer
- Workspace
- SingleChoice
Answer : 1. "712.43"
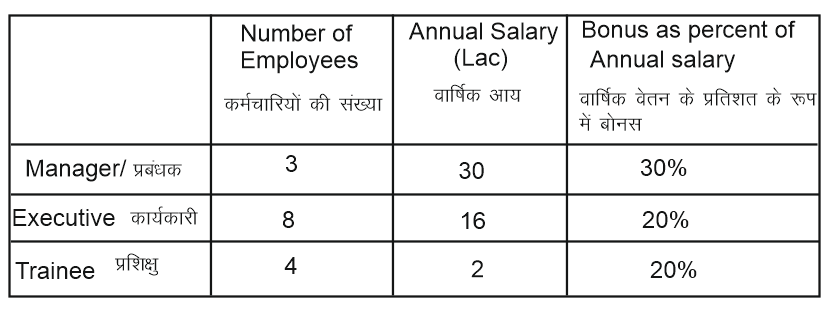
Q: Refer the below data table and answer the following questions.
What is the average bonus ( in rupees)?
1922 05f0e7eaa1090a058653e9553
5f0e7eaa1090a058653e9553What is the average bonus ( in rupees)?
- 1126000false
- 25419994false
- 3361333true
- 4None of thesefalse
- Show AnswerHide Answer
- Workspace
- SingleChoice
Answer : 3. "361333"
Q:Direction (94-98): Study the following table to answer the given questions.
Centre and Post-wise Numbered of candidate
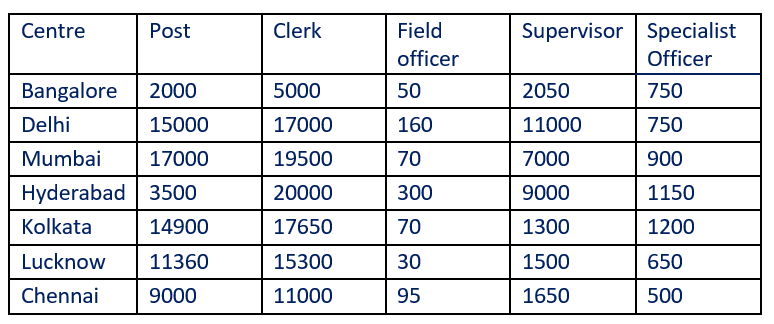
What is the difference between total number of Officers and Clerks?
1922 05da402d67919e54a8e3d287a
5da402d67919e54a8e3d287aCentre and Post-wise Numbered of candidate
- 129680false
- 234180false
- 332690true
- 428680false
- 5None of thesefalse
- Show AnswerHide Answer
- Workspace
- SingleChoice
Answer : 3. "32690"
Q:The pie chart below represents the instruments played by students of a school. Read the chart and answer the following questions based on it.
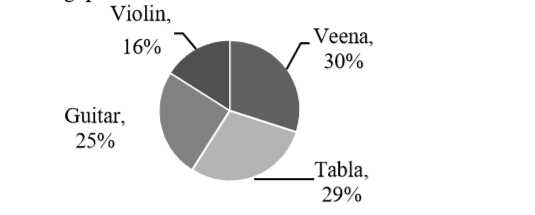
The ratio of students who play Guitar to Violin
1922 05eba32028e4fa473bcb7f6b9
5eba32028e4fa473bcb7f6b9- 15:4false
- 25:6false
- 325:16true
- 48:15false
- Show AnswerHide Answer
- Workspace
- SingleChoice
Answer : 3. "25:16 "
Q:Study the given graph and answer the question that follows.
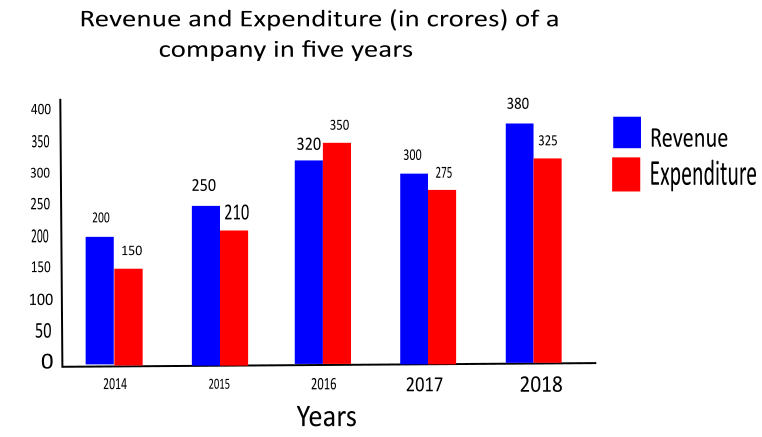
What is the ratio of the total expenditure in 2015 and 2016 to the total revenue of the company in 2016 and 2018?
1916 05fbf78fa4f2f6c622be787d2
5fbf78fa4f2f6c622be787d2- 16 : 7false
- 219: 20false
- 34 : 5true
- 411 : 20false
- Show AnswerHide Answer
- Workspace
- SingleChoice
Answer : 3. "4 : 5"
Q:Directions: The bar graph given below shows the spending of family income on various items and savings during 1993. Observe the graph and answer the following questions:
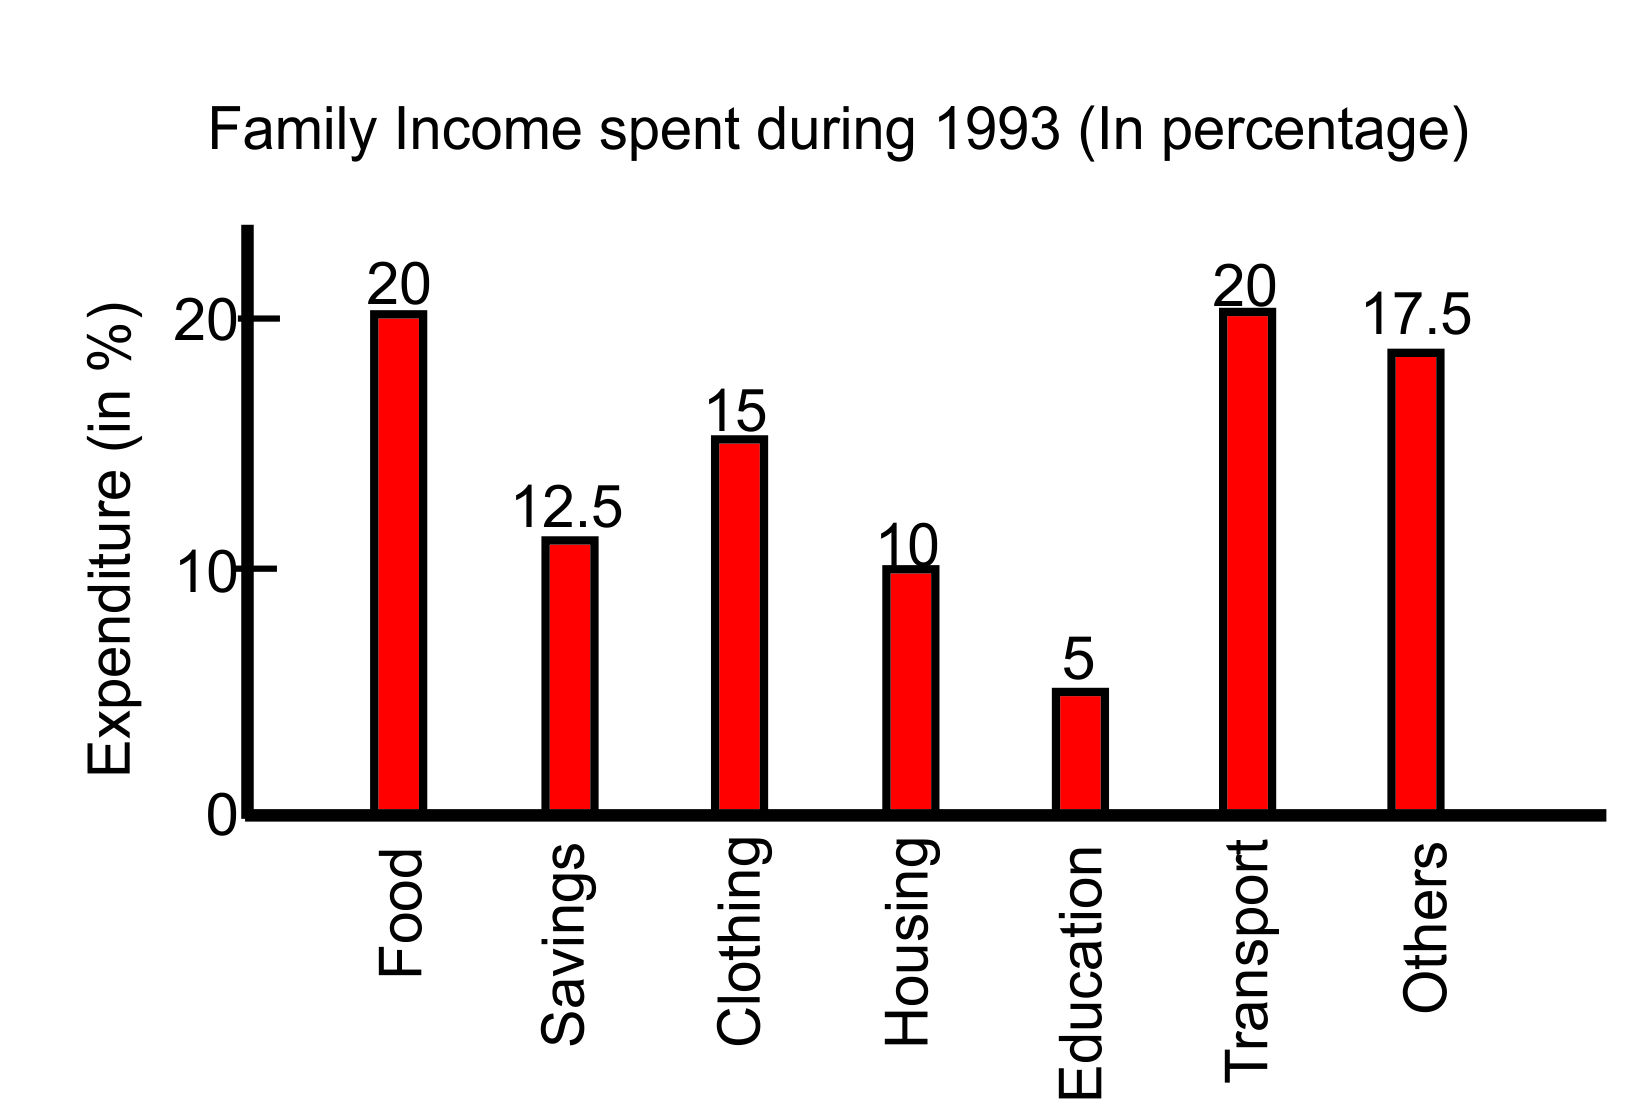
If the total income of the family during 1993 was ₹ 100000, the savings of the family in 1993 was:
1912 05def3e2d6d799a05c00a5ec8
5def3e2d6d799a05c00a5ec8- 1₹1,750false
- 2₹20,000false
- 3₹12,500true
- 4₹50,000false
- Show AnswerHide Answer
- Workspace
- SingleChoice
Answer : 3. "₹12,500 "
Q: In 2010, the population of ‘Y’ and ‘V’ increase by 10% each and the percentage of population below poverty line remains unchanged for all the villages. If in 2009, the population of village Y was 30,000 then the below poverty line population of village ‘V’ in 2010 is-
1909 15d7f2970fb24f9020863a16b
5d7f2970fb24f9020863a16b
- 111250false
- 212760true
- 313140false
- 413780false
- Show AnswerHide Answer
- Workspace
- SingleChoice