Data Interpretation Practice Question and Answer
8 Q:Direction: Study the following graph carefully and answer the questions that follow:
The graph given below represents the number of users of two broadband services A and B across 5 cities P, Q, R, S and T.
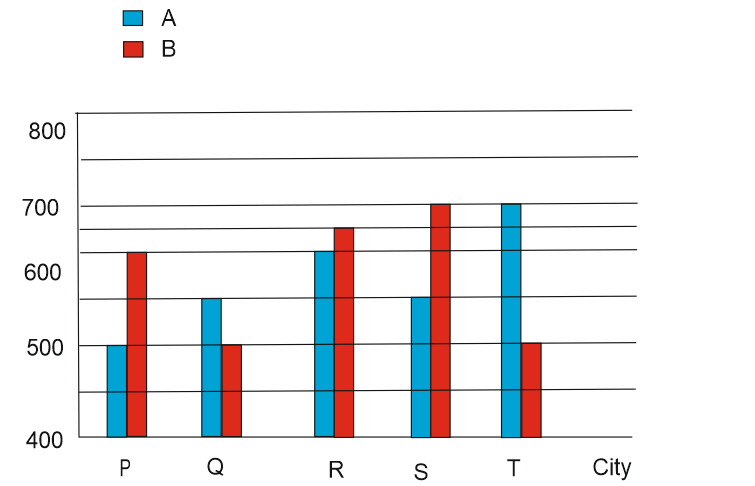
What is the difference between the total number of users of brand A and B together in City R and the total number of users of brand A and B together in City P?
1781 05df0bda2e837331209ea1b4f
5df0bda2e837331209ea1b4fThe graph given below represents the number of users of two broadband services A and B across 5 cities P, Q, R, S and T.
- 1170false
- 2140false
- 3130false
- 4150true
- 5160false
- Show AnswerHide Answer
- Workspace
- SingleChoice
Answer : 4. "150"
Q:The pie chart given below shows the number of shoes of 5 different brands in a multi brand store. There are total 1200 shoes.
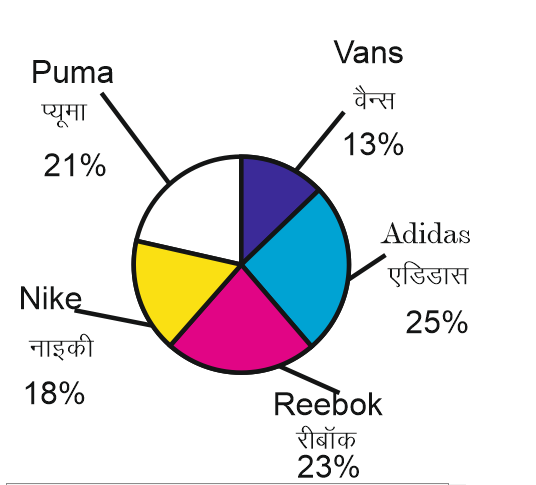
Puma shoes are how much percent more than the Nike Shoes?
1779 05efeb4917228dd6b06e755f0
5efeb4917228dd6b06e755f0- 114.28false
- 216.66true
- 325false
- 421.33false
- Show AnswerHide Answer
- Workspace
- SingleChoice
Answer : 2. "16.66"
Q: Study the following graph and answer the question that follow.
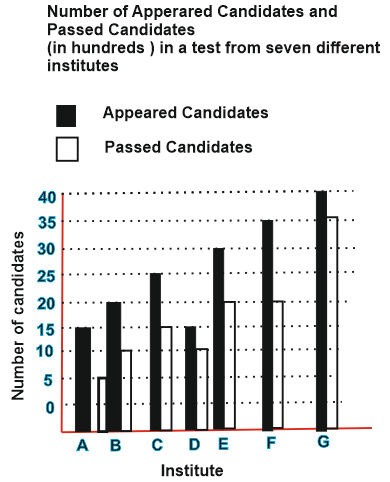 What is the different between the numbered of candidates appeared from institutes A, C, D and F together and candidates passed from institute-B, E and G together?
1777 05d860e49c1ed1701670c78af
5d860e49c1ed1701670c78afWhat is the different between the numbered of candidates appeared from institutes A, C, D and F together and candidates passed from institute-B, E and G together?- 13000false
- 21500false
- 32,000false
- 425000false
- 5None of thesetrue
- Show AnswerHide Answer
- Workspace
- SingleChoice
Answer : 5. "None of these"
Q:Direction: Study the following information to answer the questions.
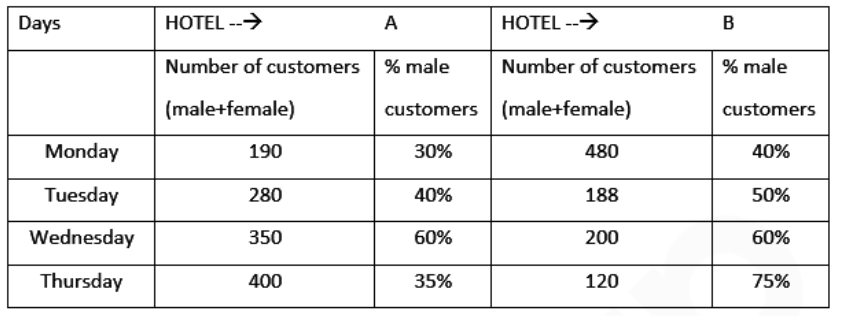
On Wednesday, in hotel A, 30% of male customers and 70% of female customers were from Town X. what was the number of customers in hotel A from town X on Wednesday?
1776 0609d19d8e941dd6183d6385e
609d19d8e941dd6183d6385e- 1153false
- 2157false
- 3161true
- 4183false
- 5181false
- Show AnswerHide Answer
- Workspace
- SingleChoice
Answer : 3. "161 "
Q:The following pie-chart shows the monthly expenditure of family on various items. If the family spends Rs. 825 on clothing answer the question
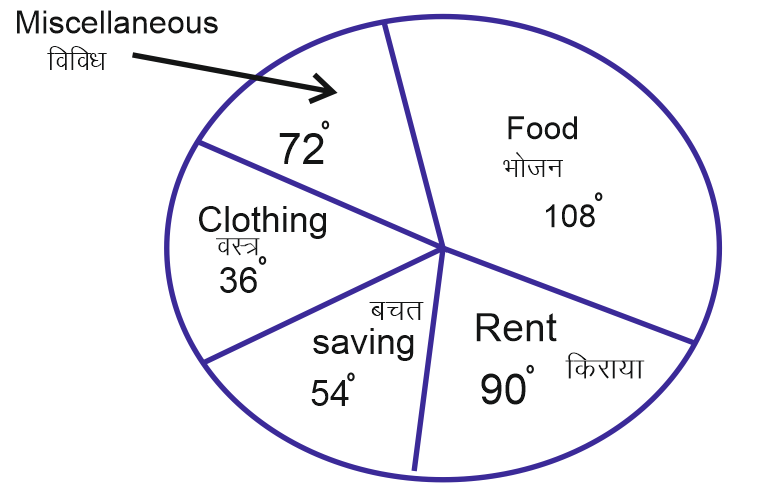
The ratio of average of expenses on food, clothing and miscellaneous items to the average of expenses of on saving and rent is
1765 05de4e1fa57778c24100555a9
5de4e1fa57778c24100555a9- 13:2false
- 22:1false
- 31:3false
- 41:1true
- Show AnswerHide Answer
- Workspace
- SingleChoice
Answer : 4. "1:1"
Q:Study the following table carefully and answer the questions given below.
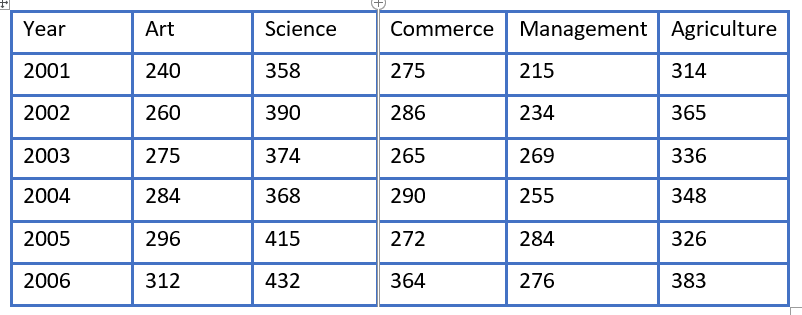
In which year was the difference in number of students in Arts and Science exactly 130?
1765 05da04eb40ba8fe2a19c21d53
5da04eb40ba8fe2a19c21d53- 12001false
- 22002true
- 32004false
- 42006false
- 5None of thesefalse
- Show AnswerHide Answer
- Workspace
- SingleChoice
Answer : 2. "2002"
Q:Directions: Given table shows the data of population in 5 different parks. Study the data carefully and answer the questions.
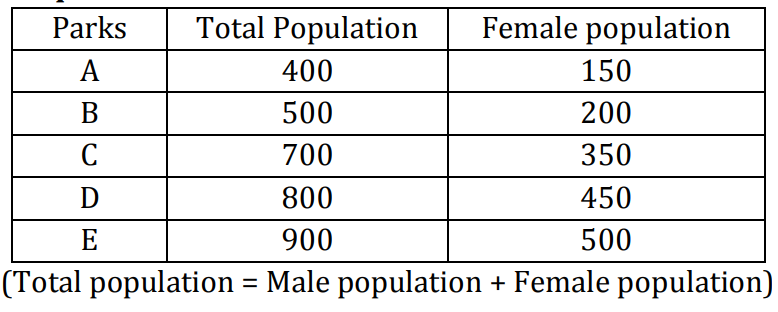
By what percent female population in park D is more or less than the male population in park E?
1762 0603f617ee759ac364c9104bf
603f617ee759ac364c9104bf- 115%false
- 29.09%false
- 311.11%false
- 414.28%false
- 512.5%true
- Show AnswerHide Answer
- Workspace
- SingleChoice
Answer : 5. "12.5%"
Q:The given pie chart shows the percentage of students enrolled for the courses A, B, C, D and E in a university and the table shows the percentage of students that passed, out of the enrolled students.
Total Students=60,000
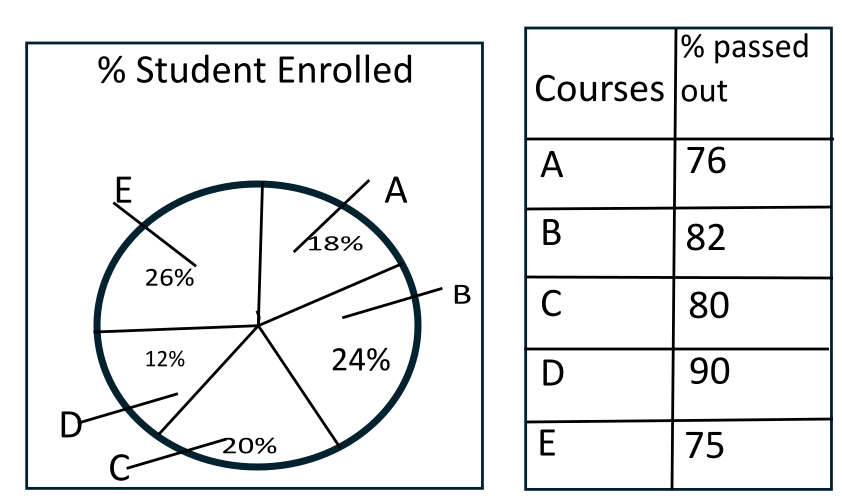
What is the ratio of Passed student in A and B ?
1761 05ffc35c1b78a0253d6ee66ff
5ffc35c1b78a0253d6ee66ffTotal Students=60,000
- 156 : 43false
- 257 : 82true
- 351 : 41false
- 447 : 67false
- Show AnswerHide Answer
- Workspace
- SingleChoice