Data Interpretation Practice Question and Answer
8 Q:Directions: Given table shows the data of population in 5 different parks. Study the data carefully and answer the questions.
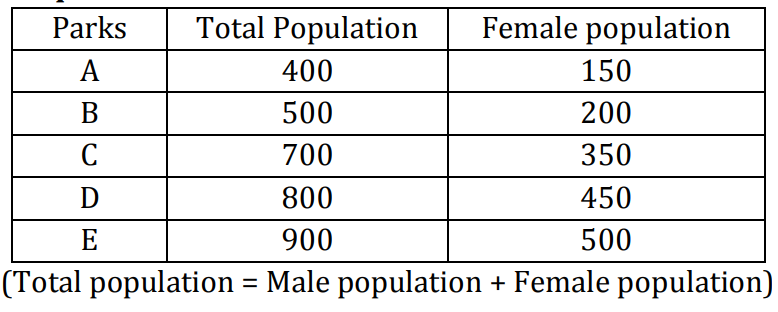
What is ratio of male population in park A & D together to female population in park B & E together?
1675 0603f61cc0634b252a6b662db
603f61cc0634b252a6b662db- 16 ∶ 7true
- 21 ∶ 1false
- 37 ∶ 6false
- 45 ∶ 6false
- 55 ∶ 7false
- Show AnswerHide Answer
- Workspace
- SingleChoice
Answer : 1. "6 ∶ 7"
Q:Directions : Given line graph shows the data of male & female population in 5 different cities. Read the data carefully and answer the questions.
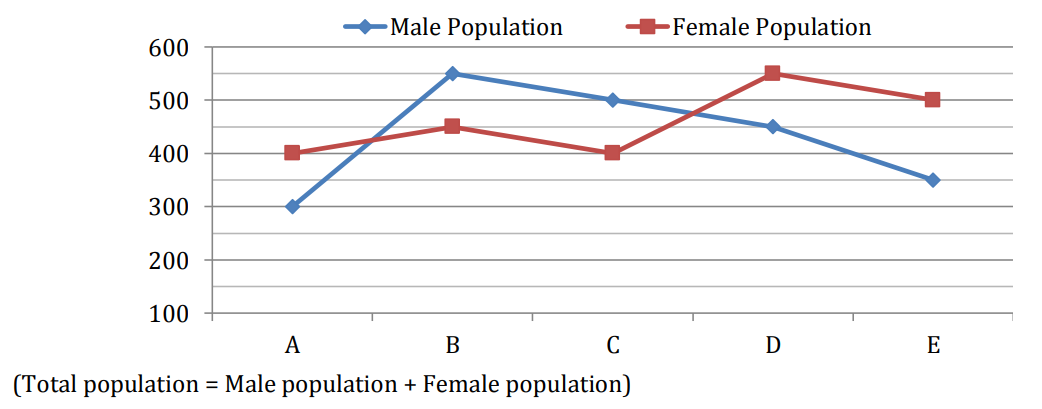
By what percent total population of city A is more or less than that of city D?
1669 060408744e759ac364c93e39d
60408744e759ac364c93e39d- 145%false
- 235%false
- 370%false
- 430%true
- 560%false
- Show AnswerHide Answer
- Workspace
- SingleChoice
Answer : 4. "30%"
Q:Direction: Study the following graph carefully and answer the questions that follow:
The graph given below represents the number of users of two broadband services A and B across 5 cities P, Q, R, S and T.
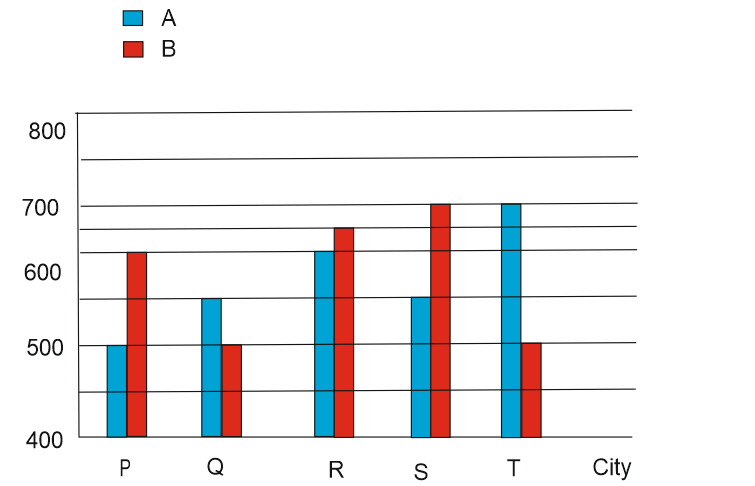
What is the total number of users of brand B across all five cities together?
1658 05df0bb273d76f974e561f39e
5df0bb273d76f974e561f39eThe graph given below represents the number of users of two broadband services A and B across 5 cities P, Q, R, S and T.
- 12700false
- 23000true
- 33100false
- 42900false
- 53200false
- Show AnswerHide Answer
- Workspace
- SingleChoice
Answer : 2. "3000"
Q:Directions: The following bar graph shows the percentage breakup of a Sunil’s salary from year 2012 to 2016. With the given information, find the following questions.
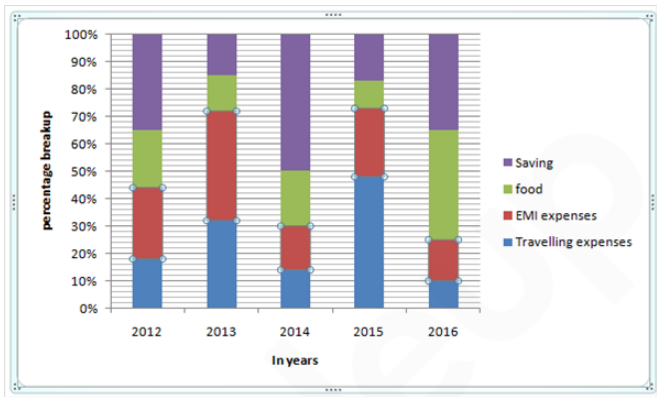
If the saving in 2012 is 4/5th of the saving in 2014. Then what is the total expenditure spent on food in 2012? (Given that total expense in 2014 is ₹ 1,85,000)
1651 060a23b25b1d2440614b98a08
60a23b25b1d2440614b98a08- 1₹ 21,100false
- 2₹ 45,100false
- 3₹ 40,400false
- 4₹ 44,400true
- 5None of thesefalse
- Show AnswerHide Answer
- Workspace
- SingleChoice
Answer : 4. "₹ 44,400"
Q:Study the following graph carefully to answer the given questions
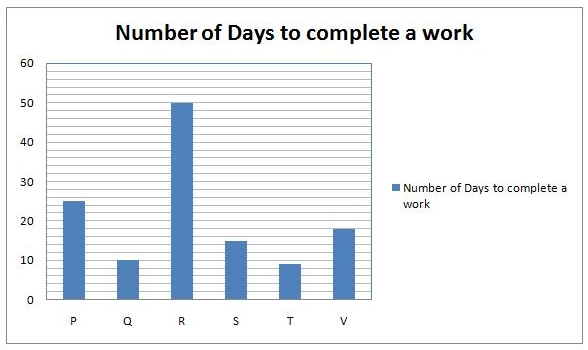
P and R started the work jointly. A few days later U also joined them and thus all of them completed the whole work in 10 days. All of them were paid total Rs.600. What is the Share of U?
1647 05ea93f53f197950c155cb511
5ea93f53f197950c155cb511- 1Rs.360false
- 2Rs.385false
- 3Rs.240true
- 4can’t be determinedfalse
- 5None of thesefalse
- Show AnswerHide Answer
- Workspace
- SingleChoice
Answer : 3. "Rs.240"
Q:Directions: The following table represents the percentage marks of four students in six subjects.
Consider the table and answer questions based on it
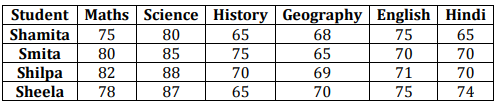
Who has the highest total marks?
1644 060795a880e46170693fcbb88
60795a880e46170693fcbb88Consider the table and answer questions based on it
- 1Shamitafalse
- 2Smitafalse
- 3Shilpatrue
- 4Sheelafalse
- Show AnswerHide Answer
- Workspace
- SingleChoice
Answer : 3. "Shilpa"
Q:The circle-graph given here shows the spending of a country on various sports during a particular year. Study the graph carefully and answer the question given below it.
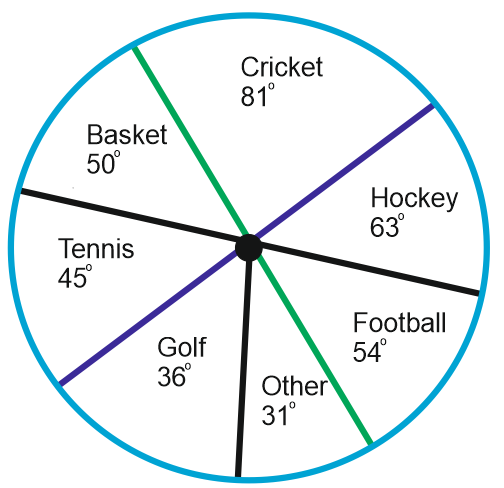
What percent of the total spending is spent on Tennis?
1640 05d70a97ed8eebc768d1123cd
5d70a97ed8eebc768d1123cd
- 1$$12{1\over 2}\%$$true
- 2$$22{1\over 2}\%$$false
- 325 %false
- 445 %false
- Show AnswerHide Answer
- Workspace
- SingleChoice
Answer : 1. " $$12{1\over 2}\%$$ "
Q:Direction: Study the following graph and answer the questions based on it.
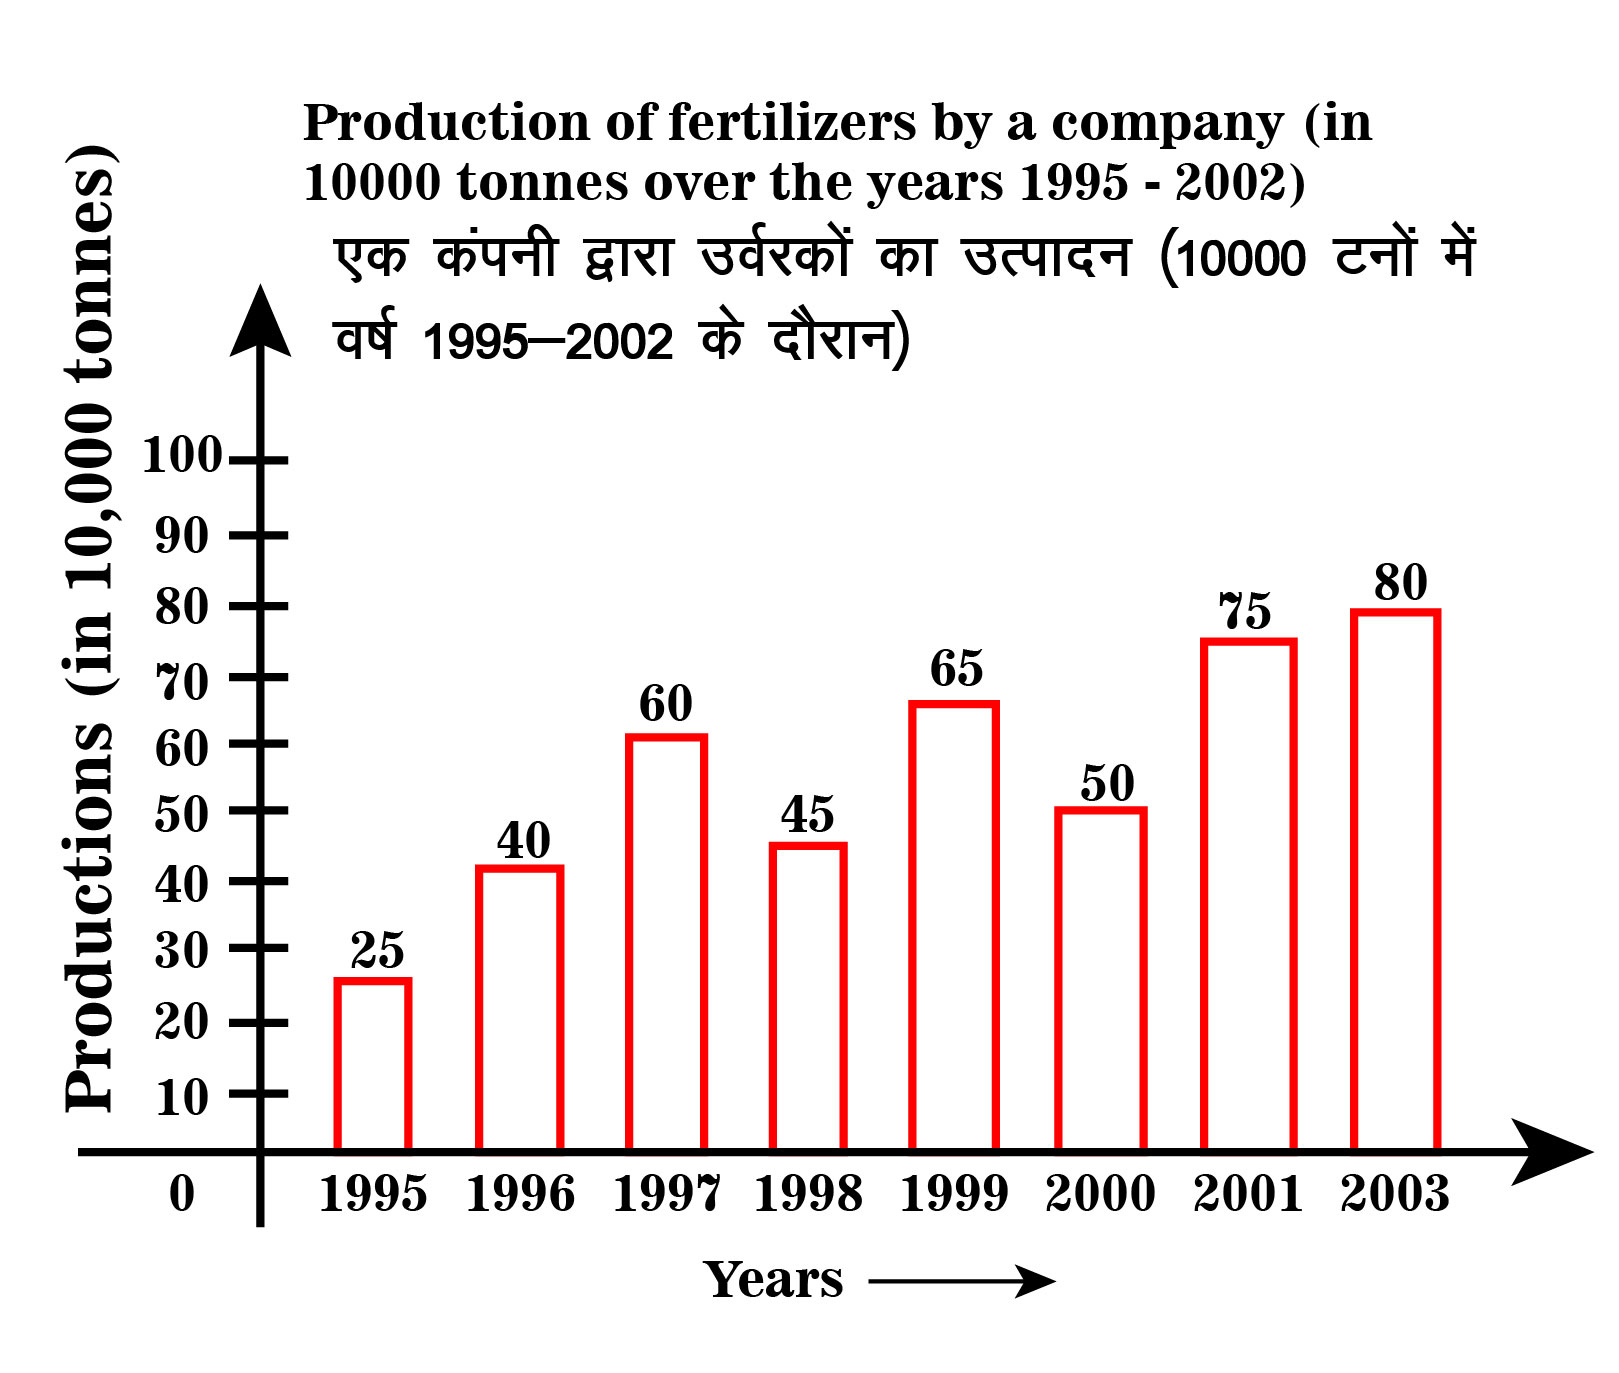
In which year was the percentage increase in production as compared to the previous year, the maximum?
1638 05ea816c4c8dec64c0097e00b
5ea816c4c8dec64c0097e00b- 12002false
- 22001false
- 31996true
- 41997false
- 5None of thesefalse
- Show AnswerHide Answer
- Workspace
- SingleChoice