Data Interpretation Practice Question and Answer
8 Q:Directions: Study the bar-graph given below & answer the questions.
Pie-chart given below shows the percentage distribution of total no. of boys in six different Schools.
Total Boys in all schools together = 6400
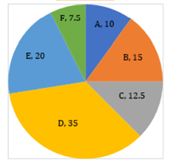
If number of boys in school A and school D together is 2/5 th of the total students in both schools then find difference of girls in school A and school D?
1594 05e93e0269255c93bdf026898
5e93e0269255c93bdf026898Pie-chart given below shows the percentage distribution of total no. of boys in six different Schools.
Total Boys in all schools together = 6400
- 1820false
- 2680false
- 3520false
- 4Cannot be determinedtrue
- 5None of thesefalse
- Show AnswerHide Answer
- Workspace
- SingleChoice
Answer : 4. "Cannot be determined"
Q:Direction: Study the following table carefully and answer the given questions. Table shows the of passed students in four schools and ratio between passed boys and girls among them. The ratio between failed boys and girls is reverse of passed ratio between them.
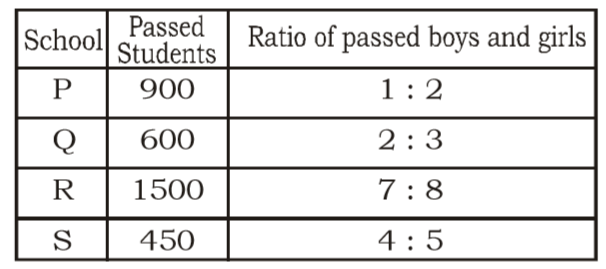
Find the ratio between the number of boys passed from School P and School Q.
1594 05e9d320cdc1ff94610d200d1
5e9d320cdc1ff94610d200d1- 14 : 5false
- 25 : 4true
- 36 : 5false
- 45 : 6false
- 51 : 2false
- Show AnswerHide Answer
- Workspace
- SingleChoice
Answer : 2. "5 : 4 "
Q:Directions: The bar chart given below shows the percentage distribution of the production of various models of a mobile manufacturing company in 2007 and 2008. The total production in 2007 was 35 lakh mobile phones and in 2008 the production was 44 lakh. Study the chart and answer the following questions.
Percentage of six different types of mobiles manufactured by a company over two year
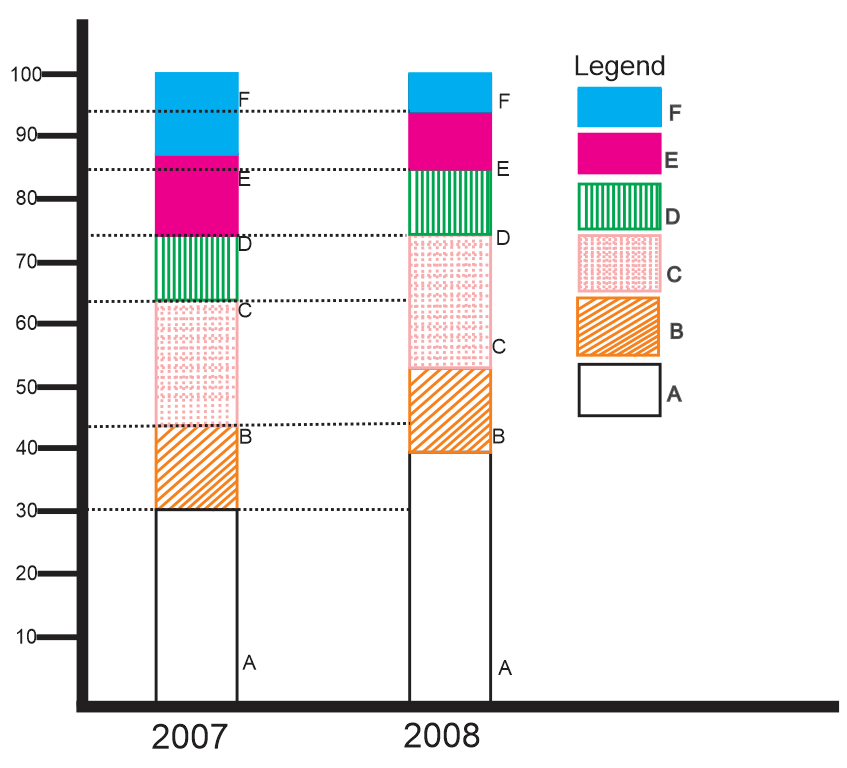
If 85% of the D type mobile produce in each year were sold by the company, how many D type mobiles remained unsold?
1590 05dd685d7c2282c484e4cab56
5dd685d7c2282c484e4cab56Percentage of six different types of mobiles manufactured by a company over two year
- 176,500false
- 293,500false
- 31,18,500true
- 41,22,500false
- Show AnswerHide Answer
- Workspace
- SingleChoice
Answer : 3. "1,18,500"
Q:Study the following table carefully and answer the questions given below.
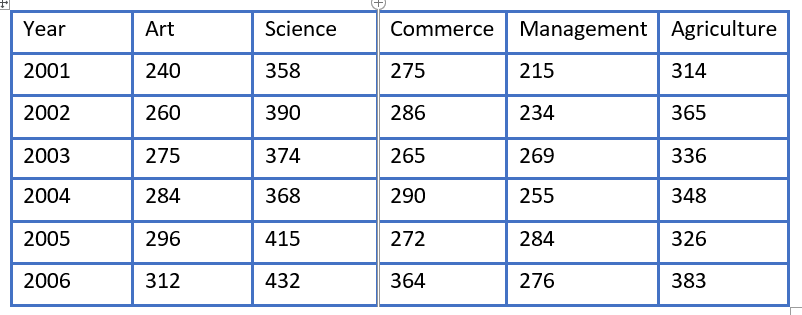
What was approximate percentage increase in the number of students in Commerce discipline from 2003 to 2004?
1590 05da051fd0ba8fe2a19c22b84
5da051fd0ba8fe2a19c22b84- 114false
- 218false
- 320false
- 49true
- 522false
- Show AnswerHide Answer
- Workspace
- SingleChoice
Answer : 4. "9"
Q: The bar chart given below shows the exports (in ₹000) and imports (in ₹000) of a country for 5 consecutive years.
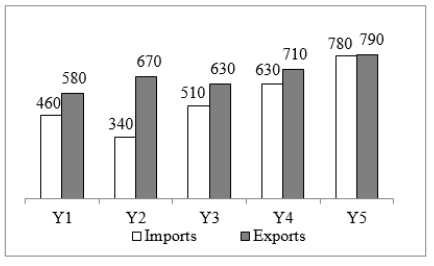
What is the positive difference in the total export figures of all the five years taken together and the total import figures of all the five years taken together?
1589 06426dfdc7ac9a186e4de97d7
6426dfdc7ac9a186e4de97d7- 1₹6,20,000false
- 2₹5,40,000false
- 3₹5,80,000false
- 4₹6,60,000true
- Show AnswerHide Answer
- Workspace
- SingleChoice
Answer : 4. "₹6,60,000"
Q:Directions: Study the bar-graph given below & answer the questions.
Pie-chart given below shows the percentage distribution of total no. of boys in six different Schools.
Total Boys in all schools together = 6400
If ratio of girls to total students in school E is 3 : 5. Then find difference of boys in school D to girls in school E?
1588 05e93decc1ca91a3c02dd540b
5e93decc1ca91a3c02dd540bPie-chart given below shows the percentage distribution of total no. of boys in six different Schools.
Total Boys in all schools together = 6400
- 1460false
- 2420false
- 3None of thesefalse
- 4360false
- 5320true
- Show AnswerHide Answer
- Workspace
- SingleChoice
Answer : 5. "320"
Q:Directions: The bar chart given below shows the percentage distribution of the production of various models of a mobile manufacturing company in 2007 and 2008. The total production in 2007 was 35 lakh mobile phones and in 2008 the production was 44 lakh. Study the chart and answer the following questions.
Percentage of six different types of mobiles manufactured by a company over two year
For which models was the percentage variation in production from 2007 to 2008 the maximum?
1583 05dd68398db51363c023a7203
5dd68398db51363c023a7203Percentage of six different types of mobiles manufactured by a company over two year
- 1B and Cfalse
- 2C and Dfalse
- 3D and Efalse
- 4A and Btrue
- Show AnswerHide Answer
- Workspace
- SingleChoice
Answer : 4. "A and B "
Q:Directions: Study the following table carefully to answer the questions that follow .
Number of soldiers ( in thousands ) joining five different forces during six different.
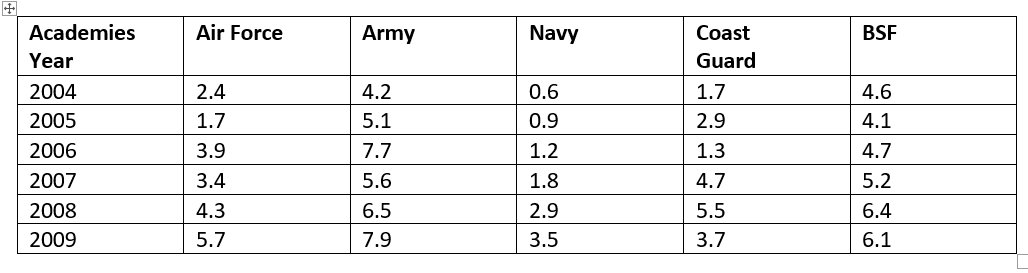
Total number of soldiers joining BSF in the years 2004, 2005 and 2006 was approximately what percent of the total number of soldiers joining Navy over all the years together?
1579 05e82e879d063766356974830
5e82e879d063766356974830Number of soldiers ( in thousands ) joining five different forces during six different.
- 1123true
- 2145false
- 3113false
- 495false
- 583false
- Show AnswerHide Answer
- Workspace
- SingleChoice