Data Interpretation Practice Question and Answer
8 Q:Study the graphs to answer these questions.
The pie chart shows the percentage of graduate employees in various department of M/S XYZ limited.
The employees in various departments of M/S. XYZ limited. Other than graduate employees are those employees who are either post graduate or undergraduates.

What percentage of other than graduate employees are there in Marketing and Planning department together?
1575 060113e91af82aa3010a29948
60113e91af82aa3010a29948The pie chart shows the percentage of graduate employees in various department of M/S XYZ limited.
The employees in various departments of M/S. XYZ limited. Other than graduate employees are those employees who are either post graduate or undergraduates.
- 155.5%false
- 275.5%false
- 377.5%true
- 467.5%false
- Show AnswerHide Answer
- Workspace
- SingleChoice
Answer : 3. "77.5%"
Q:Study the given graph carefully to answer the questions that follow:
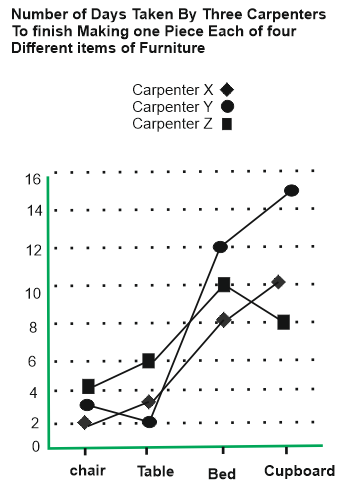
If carpenter X and carpenter Y were to make a chair together how many days would they take?
1574 05d85cf58a08f7a408051b2b8
5d85cf58a08f7a408051b2b8- 11 Daysfalse
- 24 daysfalse
- 33 daysfalse
- 42 daysfalse
- 5None of thesetrue
- Show AnswerHide Answer
- Workspace
- SingleChoice
Answer : 5. "None of these "
Q:Directions: The bar graph, given here, shows the number of tickets sold by 6 students A, B, C, D, E and F during a fair.
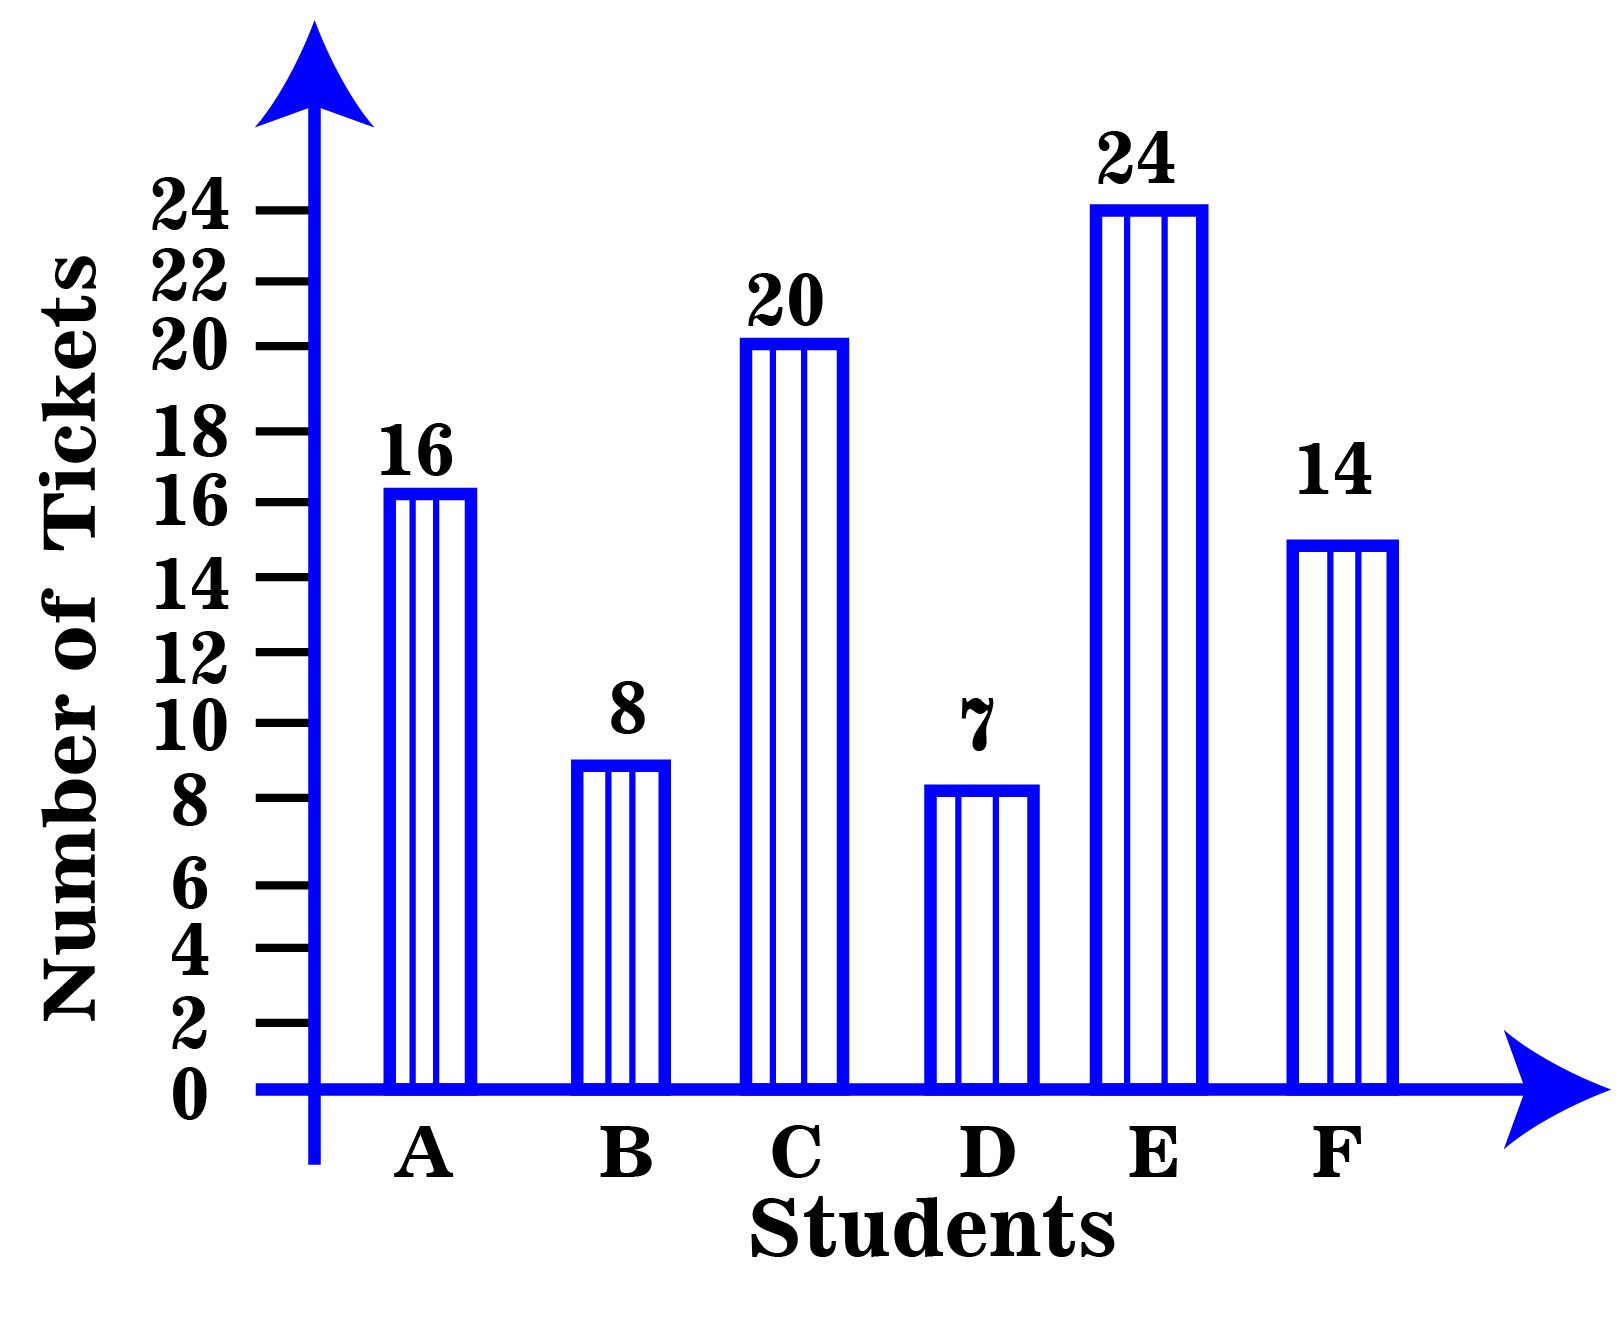
Total number of tickets sold by D, E and F is
1572 05ea814b7a63dac4c26cbdb4b
5ea814b7a63dac4c26cbdb4b- 147false
- 246false
- 345true
- 444false
- 5None of thesefalse
- Show AnswerHide Answer
- Workspace
- SingleChoice
Answer : 3. "45"
Q:Directions : A graph showing the price of rice in India during the year 2000 to 2003 is given below. Study the graph carefully and answer the questions.

For the month of May, the graph shows that the price of rice was the lowest in the year
1572 06391d74fb13d3250d3268a91
6391d74fb13d3250d3268a91- 12000false
- 22001false
- 32002false
- 42003true
- Show AnswerHide Answer
- Workspace
- SingleChoice
Answer : 4. "2003"
Q:Directions: Answer the questions based on the information given below:
The following line graph shows revenue and expenditure of company A for 5 years (in Lakhs):
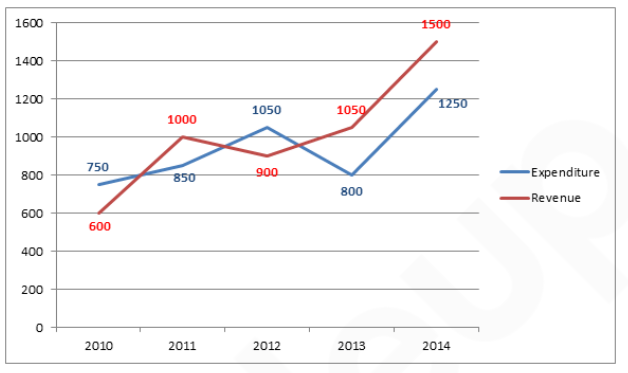
What is the average revenue of the company over the years?
1571 060a4ddf6b1d2440614c00c2e
60a4ddf6b1d2440614c00c2eThe following line graph shows revenue and expenditure of company A for 5 years (in Lakhs):
- 11050 lakhsfalse
- 22020 lakhsfalse
- 31000 lakhsfalse
- 41010 lakhstrue
- 5None of thesefalse
- Show AnswerHide Answer
- Workspace
- SingleChoice
Answer : 4. "1010 lakhs "
Q:Directions :- Refer the graph and answer the given questions.
The following line graph shows the number of products sold by company A and B during six years.
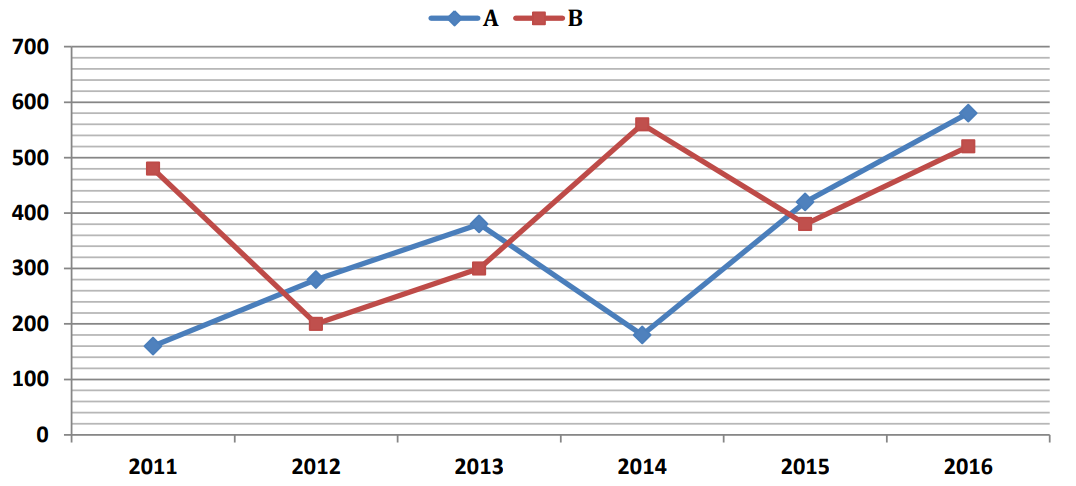
What is the difference between the total number of products sold by B in 2011, 2012 and 2016 together and the total number of products sold by A in 2011, 2012 and 2013 together?
1569 05fd32f73c46a213fc5c474b4
5fd32f73c46a213fc5c474b4The following line graph shows the number of products sold by company A and B during six years.
- 1480false
- 2360false
- 3580false
- 4380true
- 5280false
- Show AnswerHide Answer
- Workspace
- SingleChoice
Answer : 4. "380"
Q:Direction: Study the following graph and answer the questions based on it.
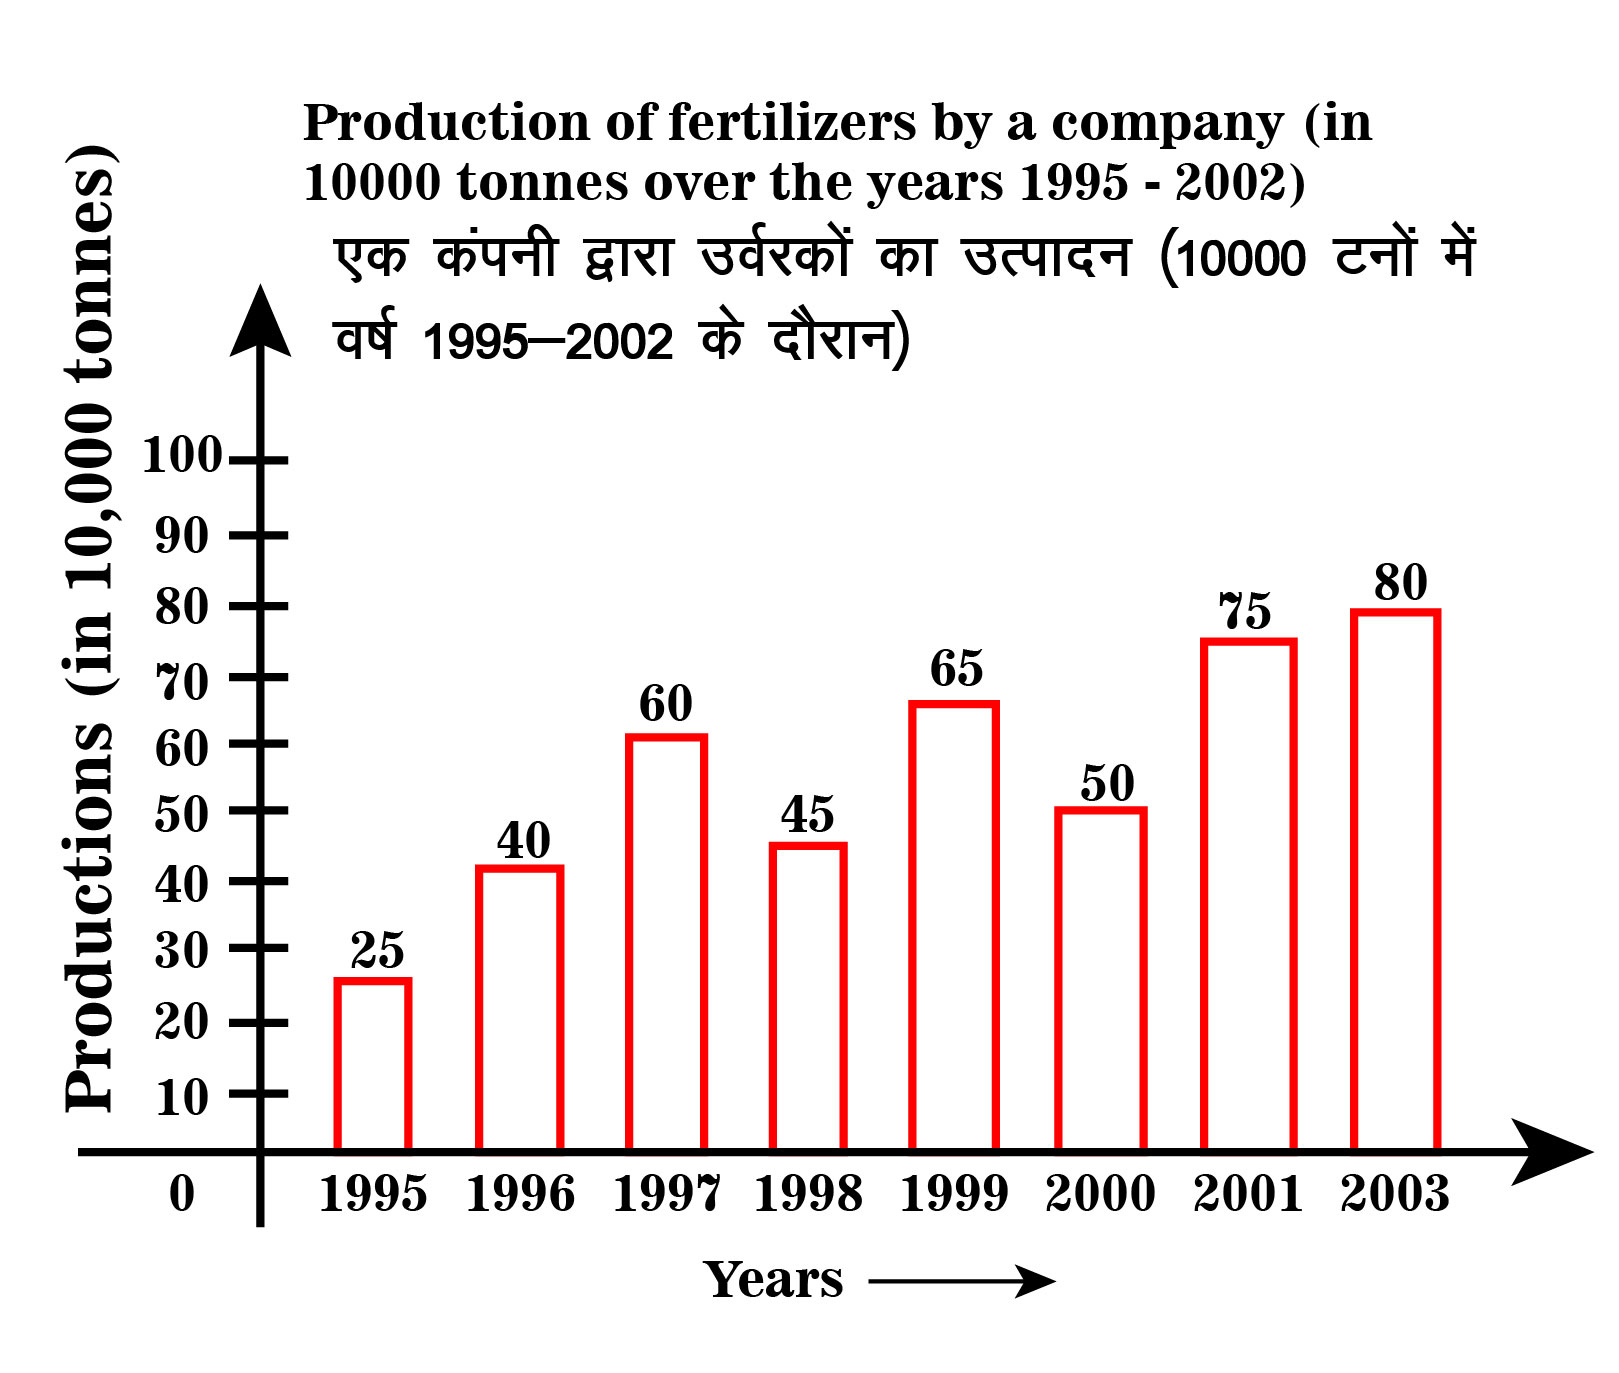
The ratio of total production of fertilizers in the year 1996 and 1997 to that of total production in the year 1995, 1998 and 2000 is
1564 05ea817103b50714be9b2441f
5ea817103b50714be9b2441f- 15 : 6true
- 26 : 5false
- 320 : 29false
- 413: 24false
- 5None of thesefalse
- Show AnswerHide Answer
- Workspace
- SingleChoice
Answer : 1. "5 : 6"
Q:Comprehension: Read the following chart and answer the following questions.
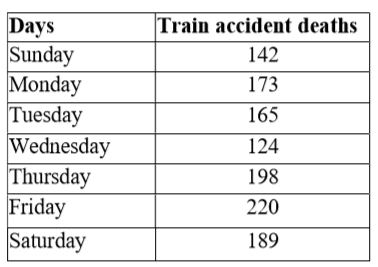
Which day of the week recorded maximum train accident deaths?
1563 05ebcc15c1126331540e94b6e
5ebcc15c1126331540e94b6e- 1Sundayfalse
- 2Thursdayfalse
- 3Fridaytrue
- 4Saturdayfalse
- Show AnswerHide Answer
- Workspace
- SingleChoice