Data Interpretation Practice Question and Answer
8 Q:Study the following table carefully and answer the questions given below.
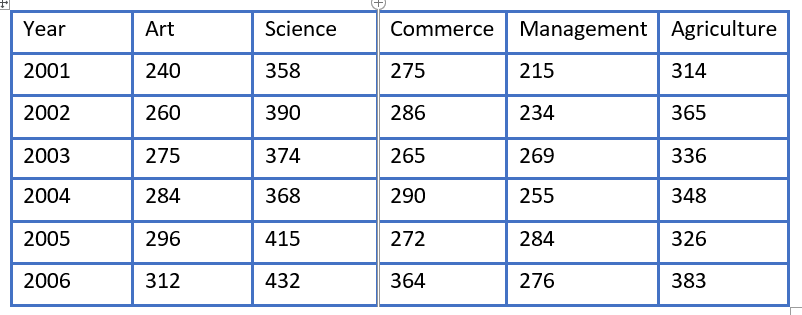
In which discipline was there a continuous increase in number of students over the given years?
1532 05da0507000e22578c9e9910f
5da0507000e22578c9e9910f- 1Sciencefalse
- 2Agriculturefalse
- 3Artstrue
- 4Commercefalse
- 5managementfalse
- Show AnswerHide Answer
- Workspace
- SingleChoice
Answer : 3. "Arts"
Q:Comprehension: Read the following chart and answer the following questions.
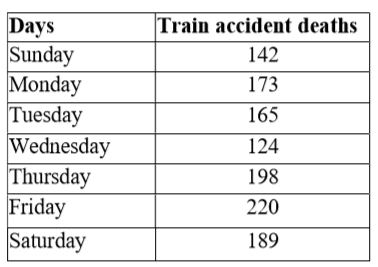
What is the difference between the day that had maximum deaths to the day that had minimum deaths?
1530 05ebcc1dcd33dc17bd494cfbe
5ebcc1dcd33dc17bd494cfbe- 1104false
- 286false
- 394false
- 496true
- Show AnswerHide Answer
- Workspace
- SingleChoice
Answer : 4. "96"
Q:Directions: Study the following data and answer the questions.
The score of students of a class are given as follows :

The number of students whose IQ score is 100 and more is
1529 0639322929dda13791d75358f
639322929dda13791d75358f- 129false
- 235true
- 336false
- 446false
- Show AnswerHide Answer
- Workspace
- SingleChoice
Answer : 2. "35 "
Q:Directions: The bar graph shows the results of an annual examination in a secondary school in a certain year. Answer the following four questions based on this chart.

The class has the highest number of passed students, is
1527 05e8afac97b82aa7479fc1df0
5e8afac97b82aa7479fc1df0- 1VIIfalse
- 2IXfalse
- 3VIIIfalse
- 4Xtrue
- Show AnswerHide Answer
- Workspace
- SingleChoice
Answer : 4. "X"
Q:Direction: Study the following information and answer the related questions. P, Q, R, S, T, A, B, C, D and E are employees of a company. A table shows the average age of any two employees of the company. The average age of A and B is 27.5.
i.e. average age of A & P is given as (A+P)/2=39.5
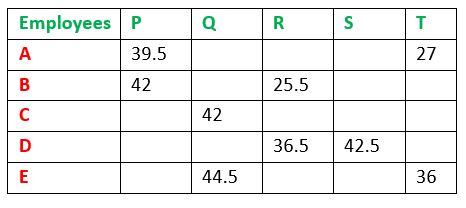
What will be the average of sum of ages of A, B, C, D and E together after five years?
1527 06062bc9d8278fd441925fe2a
6062bc9d8278fd441925fe2ai.e. average age of A & P is given as (A+P)/2=39.5
- 142.6true
- 245.5false
- 339.8false
- 440false
- 5None of thesefalse
- Show AnswerHide Answer
- Workspace
- SingleChoice
Answer : 1. "42.6 "
Q:Directions: Study the bar-graph given below & answer the questions.
Pie-chart given below shows the percentage distribution of total no. of boys in six different Schools.
Total Boys in all schools together = 6400
If total no. of students in school F is 820. Then girls in school F is approximately what percent more/less than total boys in school B?
1526 05e93dde09255c93bdf02658c
5e93dde09255c93bdf02658cPie-chart given below shows the percentage distribution of total no. of boys in six different Schools.
Total Boys in all schools together = 6400
- 165%true
- 274%false
- 358%false
- 478%false
- 555%false
- Show AnswerHide Answer
- Workspace
- SingleChoice
Answer : 1. "65%"
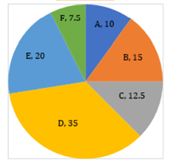
Q:The following pie-chart shows the monthly expenditure of family on various items. If the family spends Rs. 825 on clothing answer the question
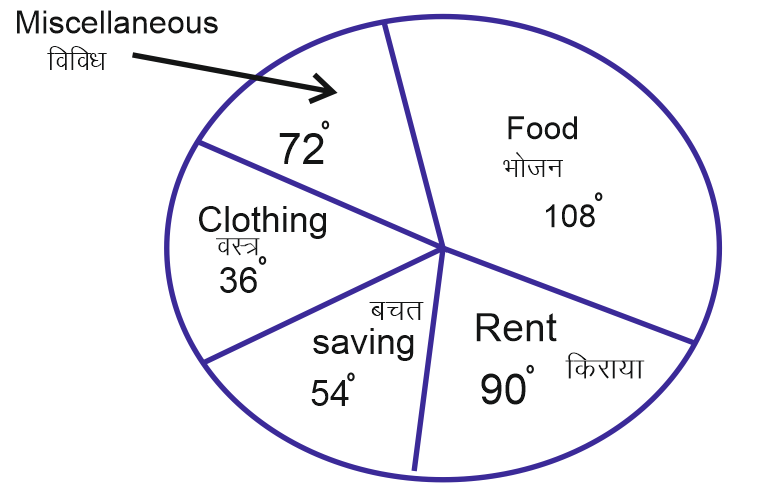
What is the ratio of expenses on food and miscellaneous ?
1523 05de4e19d57778c24100554d6
5de4e19d57778c24100554d6- 13:4false
- 23:2true
- 32:3false
- 42:5false
- Show AnswerHide Answer
- Workspace
- SingleChoice
Answer : 2. "3:2"
Q:Directions: Read the following table and answer the questions below it:
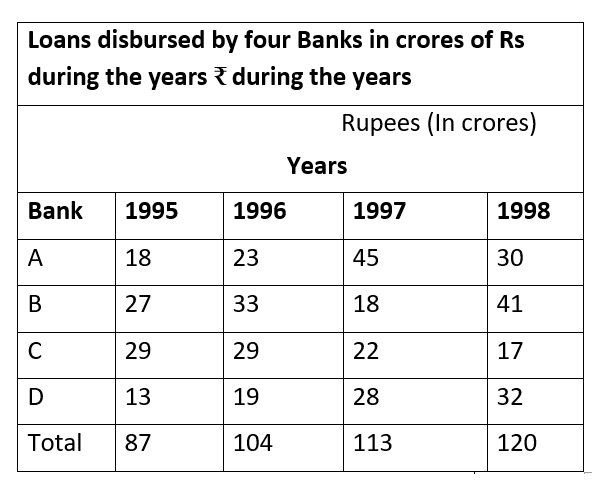
In which bank was the loan disbursement more than 30 % of the disbursement of all banks combined together in 1998?
1522 05e4e4fca701cfd31ff68f586
5e4e4fca701cfd31ff68f586- 1Afalse
- 2Btrue
- 3Cfalse
- 4Dfalse
- Show AnswerHide Answer
- Workspace
- SingleChoice