Data Interpretation Practice Question and Answer
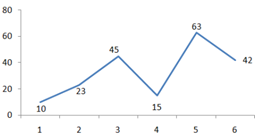
8 Q: This line graph shows the scores of a batsman in 6 consecutive matches. What is the range of his scores?
1823 060c09971c197293a4827413d
60c09971c197293a4827413d- 153true
- 243false
- 341false
- 451false
- Show AnswerHide Answer
- Workspace
- SingleChoice
Answer : 1. "53"
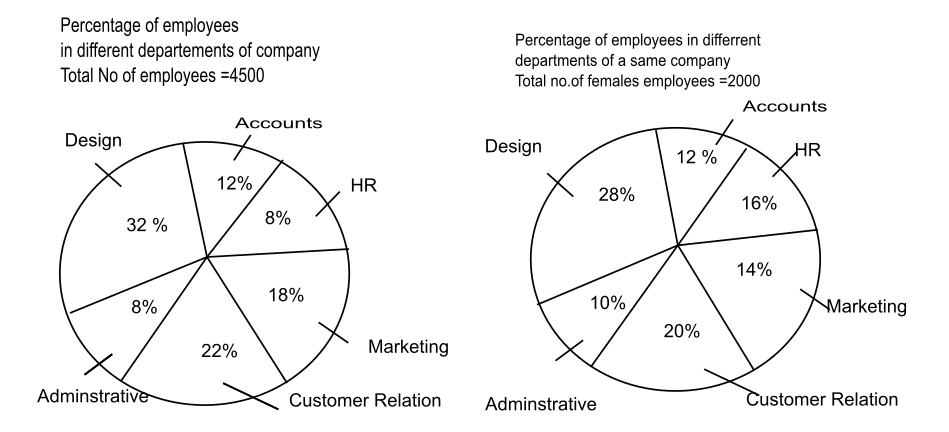
Q: What is the respective ratio of number of employees in Administrative department to the number of males in the same department?
8990 15d4abb56108bca202e8a74d9
5d4abb56108bca202e8a74d9- 19:4true
- 28:3false
- 37:2false
- 48:5false
- 5None of thesefalse
- Show AnswerHide Answer
- Workspace
- SingleChoice
Answer : 1. "9:4"
Q:Direction : The table given below represents number of bikes of five different brands sold from 2001- 2005, with the help of data given in the table, answer the following questions.
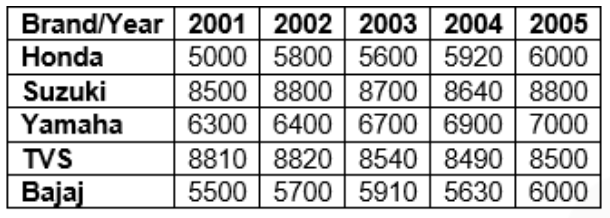
If sales of Suzuki in the year 2006 is increased by 5% and sales of Yamaha decreased by 5%, then what is the difference of averages of sales of Suzuki in year 2001 and 2006 and average sales of Yamaha in 2002 and 2006?
1271 060a4f033f98a5977251a2404
60a4f033f98a5977251a2404- 11170false
- 22000false
- 32330false
- 42345true
- 5None of thesefalse
- Show AnswerHide Answer
- Workspace
- SingleChoice
Answer : 4. "2345"
Q:Direction : The table given below represents number of bikes of five different brands sold from 2001- 2005, with the help of data given in the table, answer the following questions.
What is the ratio of average sales of TVS in year 2002 and 2005 to the average sales of Honda in year 2001 and 2004?
1198 060a4ef9163194a66f2d07028
60a4ef9163194a66f2d07028- 1273:433false
- 2433: 273true
- 3111:142false
- 4441:173false
- 5None of thesefalse
- Show AnswerHide Answer
- Workspace
- SingleChoice
Answer : 2. "433: 273"
Q:Direction : The table given below represents number of bikes of five different brands sold from 2001- 2005, with the help of data given in the table, answer the following questions.
The average sale of Bajaj from 2001 to 2005 is what percentage of total sales of Suzuki from 2001-2005?
1406 060a4ef29b33a50608a41f7ff
60a4ef29b33a50608a41f7ff- 114%false
- 213.23%true
- 312.22%false
- 415.23%false
- 5None of thesefalse
- Show AnswerHide Answer
- Workspace
- SingleChoice
Answer : 2. "13.23%"
Q:Direction : The table given below represents number of bikes of five different brands sold from 2001- 2005, with the help of data given in the table, answer the following questions.
The sales of Yamaha increased from 2001 to 2005 by what percentage?
1251 060a4eed6b33a50608a41f7f0
60a4eed6b33a50608a41f7f0- 113.33%false
- 210.6%false
- 311.11%true
- 412%false
- 5None of thesefalse
- Show AnswerHide Answer
- Workspace
- SingleChoice
Answer : 3. "11.11% "
Q:Direction : The table given below represents number of bikes of five different brands sold from 2001- 2005, with the help of data given in the table, answer the following questions.
In how many years the increase of selling is greater than 10% for any brand?
1345 060a4ee64b1d2440614c02ef0
60a4ee64b1d2440614c02ef0- 11true
- 22false
- 33false
- 44false
- 5None of thesefalse
- Show AnswerHide Answer
- Workspace
- SingleChoice
Answer : 1. "1 "
Q:Directions: Answer the questions based on the information given below:
The following line graph shows revenue and expenditure of company A for 5 years (in Lakhs):
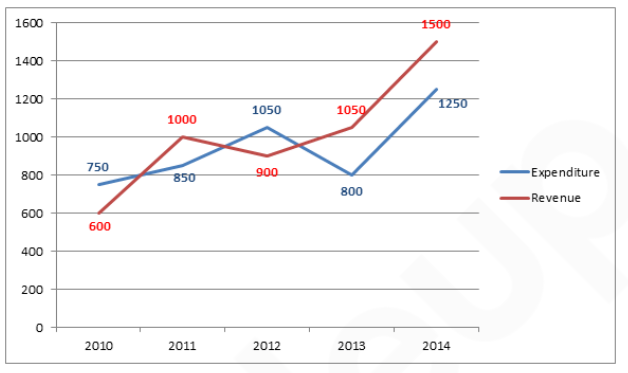
In which year was the profit percentage highest?
Given that: Profit = $$\left({Revenue-Expenditure\over Expenditure } \right)\ $$
1285 060a4e0bef98a5977251a0069
60a4e0bef98a5977251a0069The following line graph shows revenue and expenditure of company A for 5 years (in Lakhs):
Given that: Profit = $$\left({Revenue-Expenditure\over Expenditure } \right)\ $$
- 12014false
- 22010false
- 32011false
- 42012false
- 52013true
- Show AnswerHide Answer
- Workspace
- SingleChoice