Data Interpretation Practice Question and Answer
8 Q:Directions: Answer the questions based on the information given below:
The following line graph shows revenue and expenditure of company A for 5 years (in Lakhs):
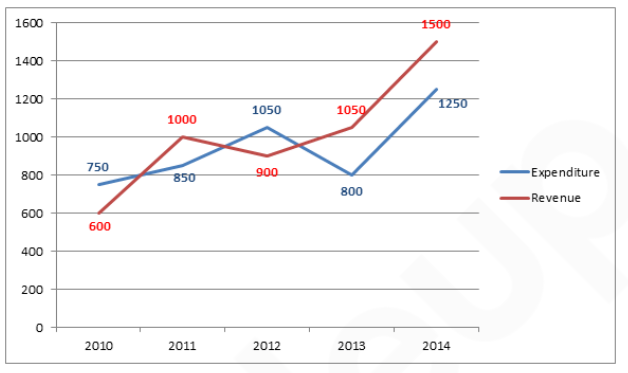
What is the ratio of sum of expenditure in the year 2012 and 2013 to that of revenue in year 2014?
1104 060a4dfcdb1d2440614c00dcb
60a4dfcdb1d2440614c00dcbThe following line graph shows revenue and expenditure of company A for 5 years (in Lakhs):
- 130: 37false
- 237: 30true
- 321: 25false
- 425: 21false
- 5None of thesefalse
- Show AnswerHide Answer
- Workspace
- SingleChoice
Answer : 2. "37: 30 "
Q:Directions: Answer the questions based on the information given below:
The following line graph shows revenue and expenditure of company A for 5 years (in Lakhs):
What is the average expenditure of the company A over the years?
1093 060a4df38f98a59772519fd74
60a4df38f98a59772519fd74The following line graph shows revenue and expenditure of company A for 5 years (in Lakhs):
- 11000 lakhsfalse
- 21010 lakhsfalse
- 3940 lakhstrue
- 4900 lakhsfalse
- 5None of thesefalse
- Show AnswerHide Answer
- Workspace
- SingleChoice
Answer : 3. "940 lakhs "
Q:Directions: Answer the questions based on the information given below:
The following line graph shows revenue and expenditure of company A for 5 years (in Lakhs):
What is the difference between revenue and expenditure of company A over the year?
1367 060a4de80b33a50608a41d237
60a4de80b33a50608a41d237The following line graph shows revenue and expenditure of company A for 5 years (in Lakhs):
- 1200 lakhsfalse
- 2300 lakhsfalse
- 3350 lakhstrue
- 4250 lakhsfalse
- 5None of thesefalse
- Show AnswerHide Answer
- Workspace
- SingleChoice
Answer : 3. "350 lakhs "
Q:Directions: Answer the questions based on the information given below:
The following line graph shows revenue and expenditure of company A for 5 years (in Lakhs):
What is the average revenue of the company over the years?
1571 060a4ddf6b1d2440614c00c2e
60a4ddf6b1d2440614c00c2eThe following line graph shows revenue and expenditure of company A for 5 years (in Lakhs):
- 11050 lakhsfalse
- 22020 lakhsfalse
- 31000 lakhsfalse
- 41010 lakhstrue
- 5None of thesefalse
- Show AnswerHide Answer
- Workspace
- SingleChoice
Answer : 4. "1010 lakhs "
Q:Direction: Study the pie chart carefully and answer the given questions. The pie chart shows the percentage breakup of students in different classes from VI to X in the year 2017
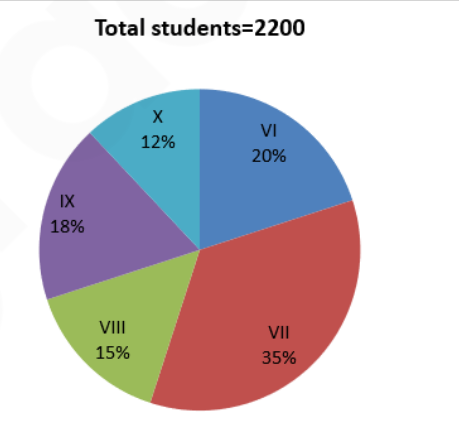
What is the difference between the total number of students in class VII and class VIII together to that of the total number of students in class IX and class X together?
1412 060a258bbde4c2e1331dbeaf6
60a258bbde4c2e1331dbeaf6- 1400false
- 2560false
- 3480false
- 4520false
- 5440true
- Show AnswerHide Answer
- Workspace
- SingleChoice
Answer : 5. "440"
Q:Direction: Study the pie chart carefully and answer the given questions. The pie chart shows the percentage breakup of students in different classes from VI to X in the year 2017
If the total number of boys in class VIII is “x” and the total number of boys in class IX is “x+40”. The total number of girls in class VIII and class IX together is 306. Then find the value of “x”.
1382 060a25856de4c2e1331dbead3
60a25856de4c2e1331dbead3- 1184false
- 2196false
- 3190true
- 4210false
- 5174false
- Show AnswerHide Answer
- Workspace
- SingleChoice
Answer : 3. "190"
Q:Direction: Study the pie chart carefully and answer the given questions. The pie chart shows the percentage breakup of students in different classes from VI to X in the year 2017
If in 2018, the total number of students in class VI and class VII is increased by 10% each and the total number of students in class VIII is decreased by 20% then what is the difference between the total number of students in class VI and VII together in 2018 to that of the total number of students in class VIII in 2018?
1263 060a257bcde4c2e1331dbeaa4
60a257bcde4c2e1331dbeaa4- 11078false
- 2878false
- 3976false
- 41067true
- 51156false
- Show AnswerHide Answer
- Workspace
- SingleChoice
Answer : 4. "1067"
Q:Direction: Study the pie chart carefully and answer the given questions. The pie chart shows the percentage breakup of students in different classes from VI to X in the year 2017
If in class VI, the ratio of boys to girls is 6:5 and the total number of girls in class VI is 50 less than that of the total number of girls in class VII. Find the ratio of the total number of boys in class VI to class VII.
1745 060a25701de4c2e1331dbe874
60a25701de4c2e1331dbe874- 16:13true
- 24:5false
- 35:7false
- 47:11false
- 59:13false
- Show AnswerHide Answer
- Workspace
- SingleChoice