Data Interpretation Practice Question and Answer
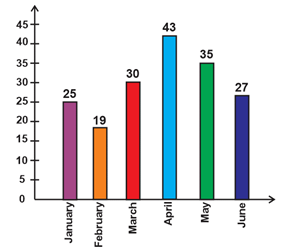
8 Q: The bar-chart is showing the number of Accidents in a city during the first six month of a year. Examine the bar chart and answer the following questions.
What is the percentage of accidents in the month of April to the total accidents in the city?
4689 05d775e76315eb75b14639a53
5d775e76315eb75b14639a53What is the percentage of accidents in the month of April to the total accidents in the city?
- 115%false
- 220%false
- 322%false
- 424%true
- Show AnswerHide Answer
- Workspace
- SingleChoice
Answer : 4. "24%"
Q:Direction: Study the double bar graph given below and answer the questions.
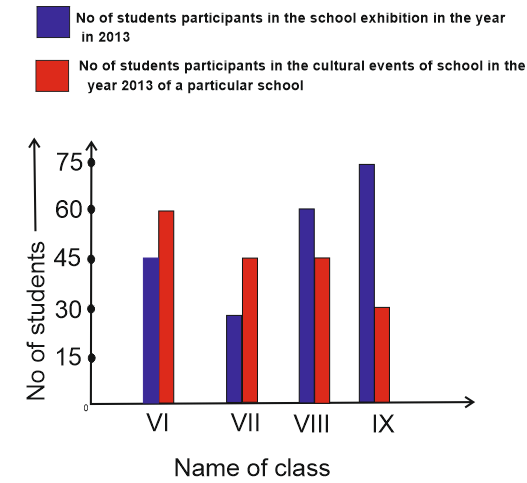
The ratio of the participants in exhibition of class IX with the total participants of class IX is:
4204 05d9323026819c079458b8139
5d9323026819c079458b8139- 15:7true
- 25:14false
- 31:4false
- 43:5false
- Show AnswerHide Answer
- Workspace
- SingleChoice
Answer : 1. "5:7"
Q:Directions: Given table shows the data of population in 5 different parks. Study the data carefully and answer the questions.
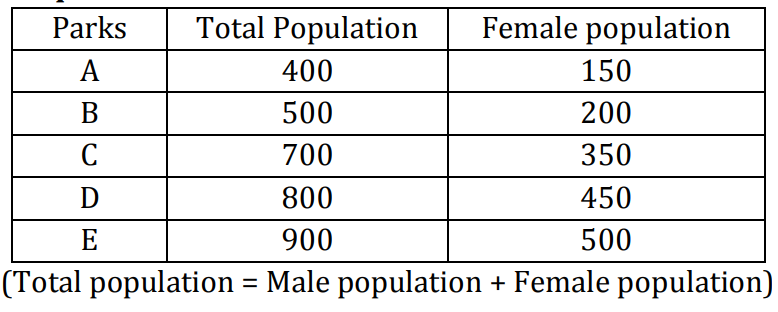
If 20% of total population did not visit on a particular day in park A of which male population was 60% then what percent of total population in park B is male population who visited in park A?
4169 0603f5f4856eac5533a8f3797
603f5f4856eac5533a8f3797- 145%false
- 240.4%true
- 339.2%false
- 448.6%false
- 5None of thesefalse
- Show AnswerHide Answer
- Workspace
- SingleChoice
Answer : 2. "40.4%"
Q:Direction: Study the double bar graph given below and answer the questions.
The average of the number of students participating in exhibition is:
3927 05d932291bc45ad7944d99fa0
5d932291bc45ad7944d99fa0- 148.75false
- 252.5true
- 345false
- 450false
- Show AnswerHide Answer
- Workspace
- SingleChoice
Answer : 2. "52.5"
Q:Direction: The line chart given below shows the number of labors (men and women) working in six different years. Study the data carefully and answer the following questions.
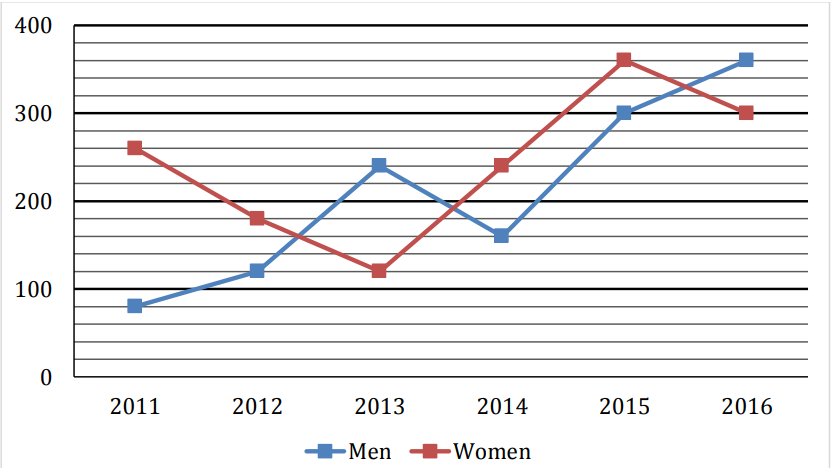
Average number of Women working in 2014, 2015 and 2016 together is how much more/less than average number of Men working in 2011, 2014 and 2016 together?
3828 0603dc6d5e759ac364c8b9e0d
603dc6d5e759ac364c8b9e0d- 190false
- 270false
- 3100true
- 480false
- 5None of the given optionsfalse
- Show AnswerHide Answer
- Workspace
- SingleChoice
Answer : 3. "100 "
Q:Study the following pie-diagrams carefully and answer the question given below it.
PERCENTAGE COMPOSITION OF HUMAN BODY
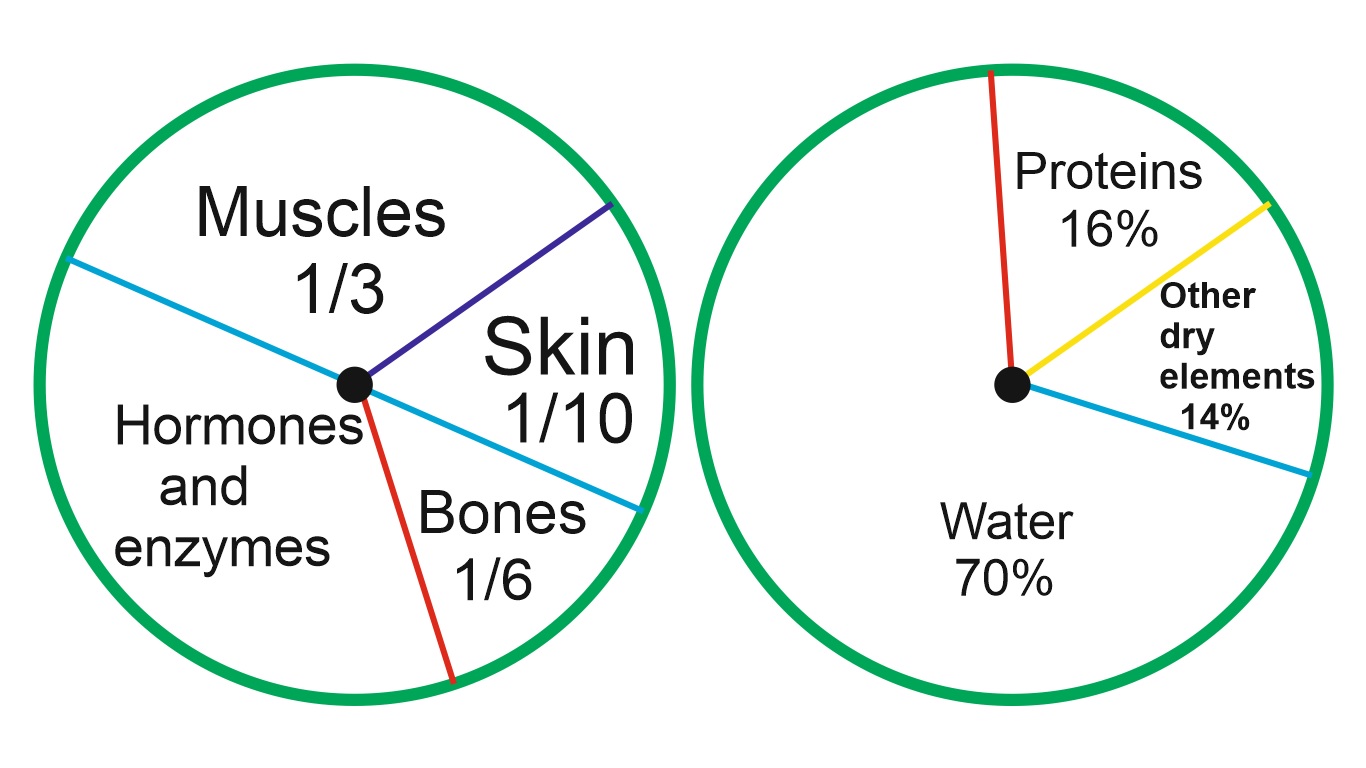
What is the ratio of the distribution of proteins in the muscles to that of the distribution of proteins in the bones? 3698 05c2ca3439fd00135a4b20f5e
5c2ca3439fd00135a4b20f5ePERCENTAGE COMPOSITION OF HUMAN BODY
- 11: 18false
- 21: 2false
- 32: 1true
- 418: 1false
- Show AnswerHide Answer
- Workspace
- SingleChoice
Answer : 3. "2: 1"
Q:Study the following pie-diagrams carefully and answer the question given below it.
PERCENTAGE COMPOSITION OF HUMAN BODY
In the human body, what part is made of neither bones nor skin?
3639 05dcc0484f348e931548d760d
5dcc0484f348e931548d760dPERCENTAGE COMPOSITION OF HUMAN BODY
- 1$${1\over 40}$$false
- 2$${3\over 80}$$false
- 3$${2\over 5}$$false
- 4None of thesetrue
- Show AnswerHide Answer
- Workspace
- SingleChoice
Answer : 4. "None of these"
Q:Study the following graph to answer these questions :
Percent profit earned by two companies A & B over the years.
Profit = Income – Expenditure
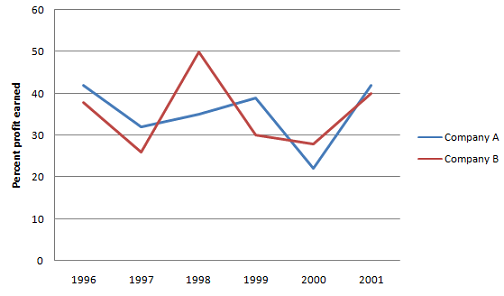
Expenditure of Company B in 1999 was 90% of its expenditure in 1998. Income of Company B in 1999 was what percent of its income in 1998?
3598 05e79aaa54572817353d62577
5e79aaa54572817353d62577Percent profit earned by two companies A & B over the years.
Profit = Income – Expenditure
- 1130.5false
- 2$$ {96 {2\over3}}$$false
- 3121.5false
- 4$$ {99 {1\over3}}$$true
- 5None of thesefalse
- Show AnswerHide Answer
- Workspace
- SingleChoice