Data Interpretation Practice Question and Answer
8 Q:Direction: Read the following graph carefully and answer the following questions:
The following bar graph shows the quantity(in kg) of wheat, rice, pulses and salts sold by two companies P and Q in the month of January.
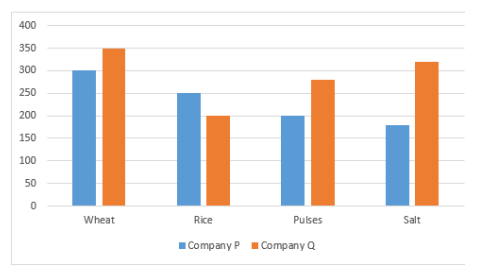
The quantity(in kg) of wheat, rice, pulses and salts sold by two companies P and Q together in the month of February is 12.5% more than the total quantities sold by two companies P and Q together in the month of January. Find the total quantities of all the four items sold in the month of February.
1470 064ddf5b474cca4494978aed5
64ddf5b474cca4494978aed5The following bar graph shows the quantity(in kg) of wheat, rice, pulses and salts sold by two companies P and Q in the month of January.
- 12340 kgtrue
- 22500 kgfalse
- 32750 kgfalse
- 42330 kgfalse
- 52440 kgfalse
- Show AnswerHide Answer
- Workspace
- SingleChoice
Answer : 1. "2340 kg "
Q:Directions: The following bar graph shows the percentage breakup of a Sunil’s salary from year 2012 to 2016. With the given information, find the following questions.
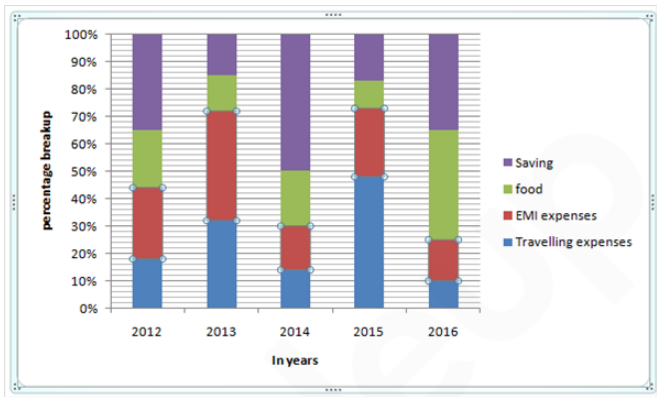
What approx. percentage of average money spend by Sunil on food to that of average money saved by him during all these years if his salary per annum was ₹ 5,00,000
1470 060a23d0a3c86b05632619055
60a23d0a3c86b05632619055- 169%false
- 266%false
- 365%false
- 470%false
- 568%true
- Show AnswerHide Answer
- Workspace
- SingleChoice
Answer : 5. "68% "
Q: The following pie chart gives the measures of the central angles of the sectors that reflect the number of beds in each of 7 different hospitals with respect to the total number of beds in these 7 hospitals taken together.
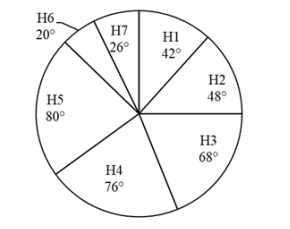
If the number of beds in H7 are 39, then what is the total number of beds in all the 7 hospitals taken together?
1469 0642251abdcb650c1456482a5
642251abdcb650c1456482a5- 1720false
- 2540true
- 3450false
- 4630false
- Show AnswerHide Answer
- Workspace
- SingleChoice
Answer : 2. "540"
Q:The following table shows the number of units of product produced and sold by a company during six years.
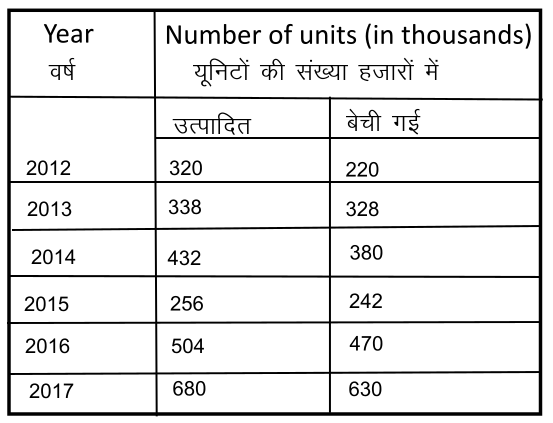
In which two years were the maximum units sold?
1466 05f6d9b77ec13dd7480045efe
5f6d9b77ec13dd7480045efe- 12013, 2017false
- 22016, 2017true
- 32013, 2014false
- 42015, 2017false
- Show AnswerHide Answer
- Workspace
- SingleChoice
Answer : 2. "2016, 2017"
Q: Study the given pie-chart and answer the question that follows.
The pie-chart shows the percentage distribution of the number of different types of chocolates distributed by Akanksha to the residents of a children's home, as percentages of all the chocolates taken together, that were distributed by her to these residents.
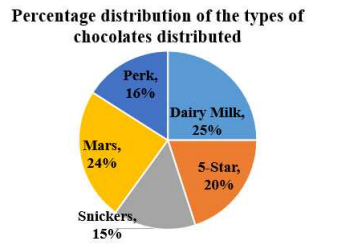
The average number of chocolates of Dairy Milk, 5-Star and Snickers taken together is equal to the number of chocolates distributed of which of the given types?
1466 0642814547ac9a186e4e0489f
642814547ac9a186e4e0489f- 15-Startrue
- 2Daily Milkfalse
- 3Perkfalse
- 4Marsfalse
- Show AnswerHide Answer
- Workspace
- SingleChoice
Answer : 1. "5-Star"
Q:Directions: The following table represents the percentage marks of four students in six subjects.
Consider the table and answer questions based on it
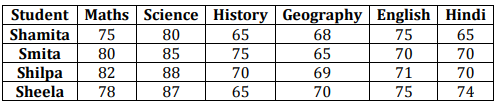
The average marks obtained by the students in Geography and History are
1464 0607959650372d85428890b88
607959650372d85428890b88Consider the table and answer questions based on it
- 168.75 and 68false
- 270.5 and 69false
- 368 and 68.75true
- 468.75 and 68.5false
- Show AnswerHide Answer
- Workspace
- SingleChoice
Answer : 3. "68 and 68.75"
Q:Directions: The bar graph given below shows the spending of family income on various items and savings during 1993. Observe the graph and answer the following questions:
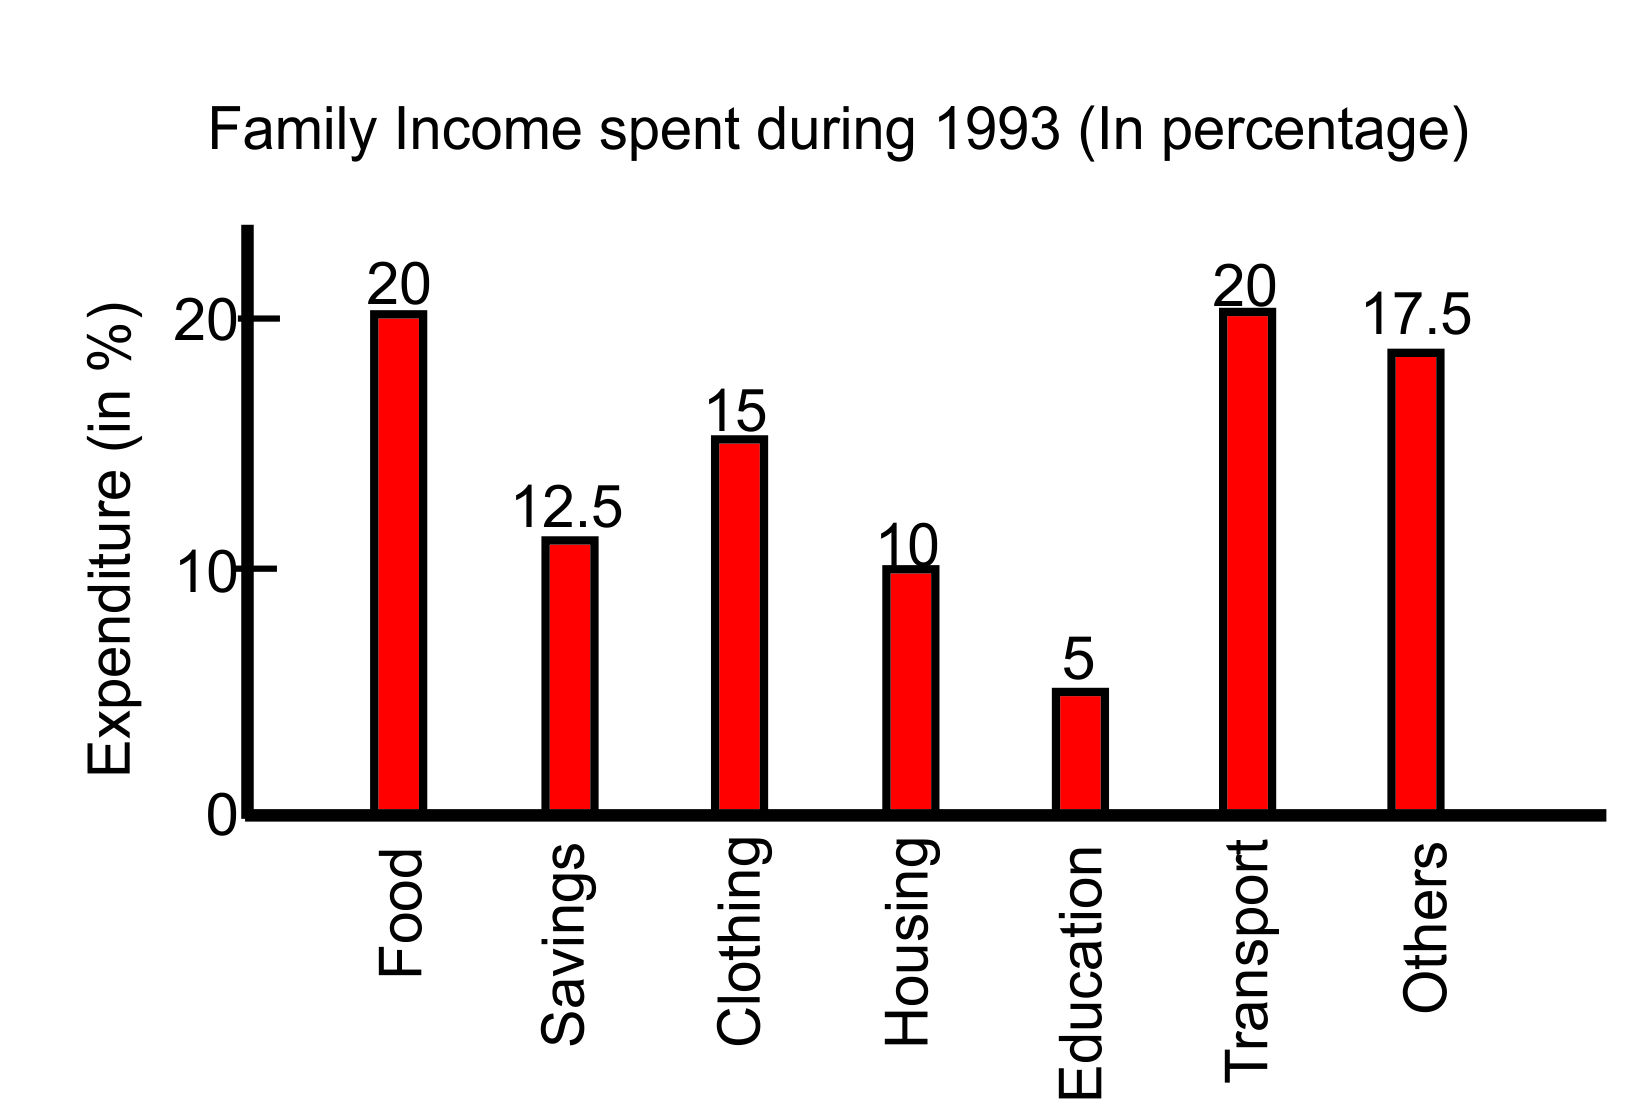
The total expenses of the family on transport is equal to those spent on:
1463 05def3eea806c5b05d54f2644
5def3eea806c5b05d54f2644- 1savingsfalse
- 2clothingfalse
- 3foodtrue
- 4othersfalse
- Show AnswerHide Answer
- Workspace
- SingleChoice
Answer : 3. "food "
Q:The line graph shows the number of vacancies of accountants in a certain company. Study the diagram and answer the following questions.
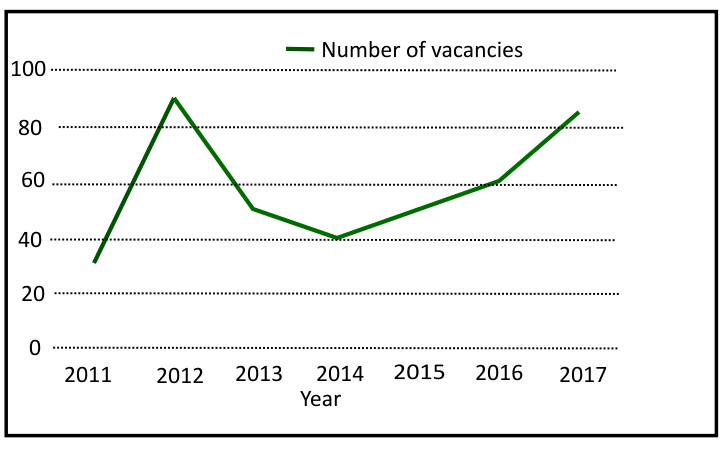
Between which two years is the rate of decrement in vacancies is maximum?
1463 05f5b079c69ed13038c1a6f39
5f5b079c69ed13038c1a6f39- 12013-2014false
- 22012-2015false
- 32012-2014false
- 42012-2013true
- Show AnswerHide Answer
- Workspace
- SingleChoice