Data Interpretation Practice Question and Answer
8 Q:Directions: Study the following table carefully to answer the questions that follow .
Number of soldiers ( in thousands ) joining five different forces during six different.
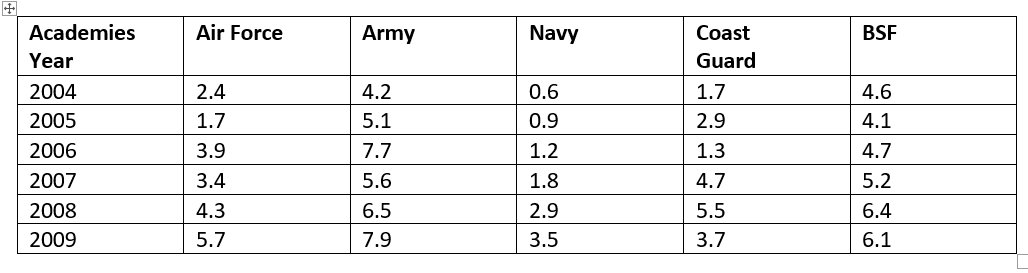
In which force the number of the soldiers joining continuously increased from the year 2004 to 2009 ?
1446 05e82eb03a03c856bcca7fb5e
5e82eb03a03c856bcca7fb5eNumber of soldiers ( in thousands ) joining five different forces during six different.
- 1Air Forcefalse
- 2Army & BSF onlyfalse
- 3Coast Guardfalse
- 4Navy onlytrue
- 5BSF & Navy onlyfalse
- Show AnswerHide Answer
- Workspace
- SingleChoice
Answer : 4. "Navy only "
Q:Direction: Study the following graph and answer the questions based on it.
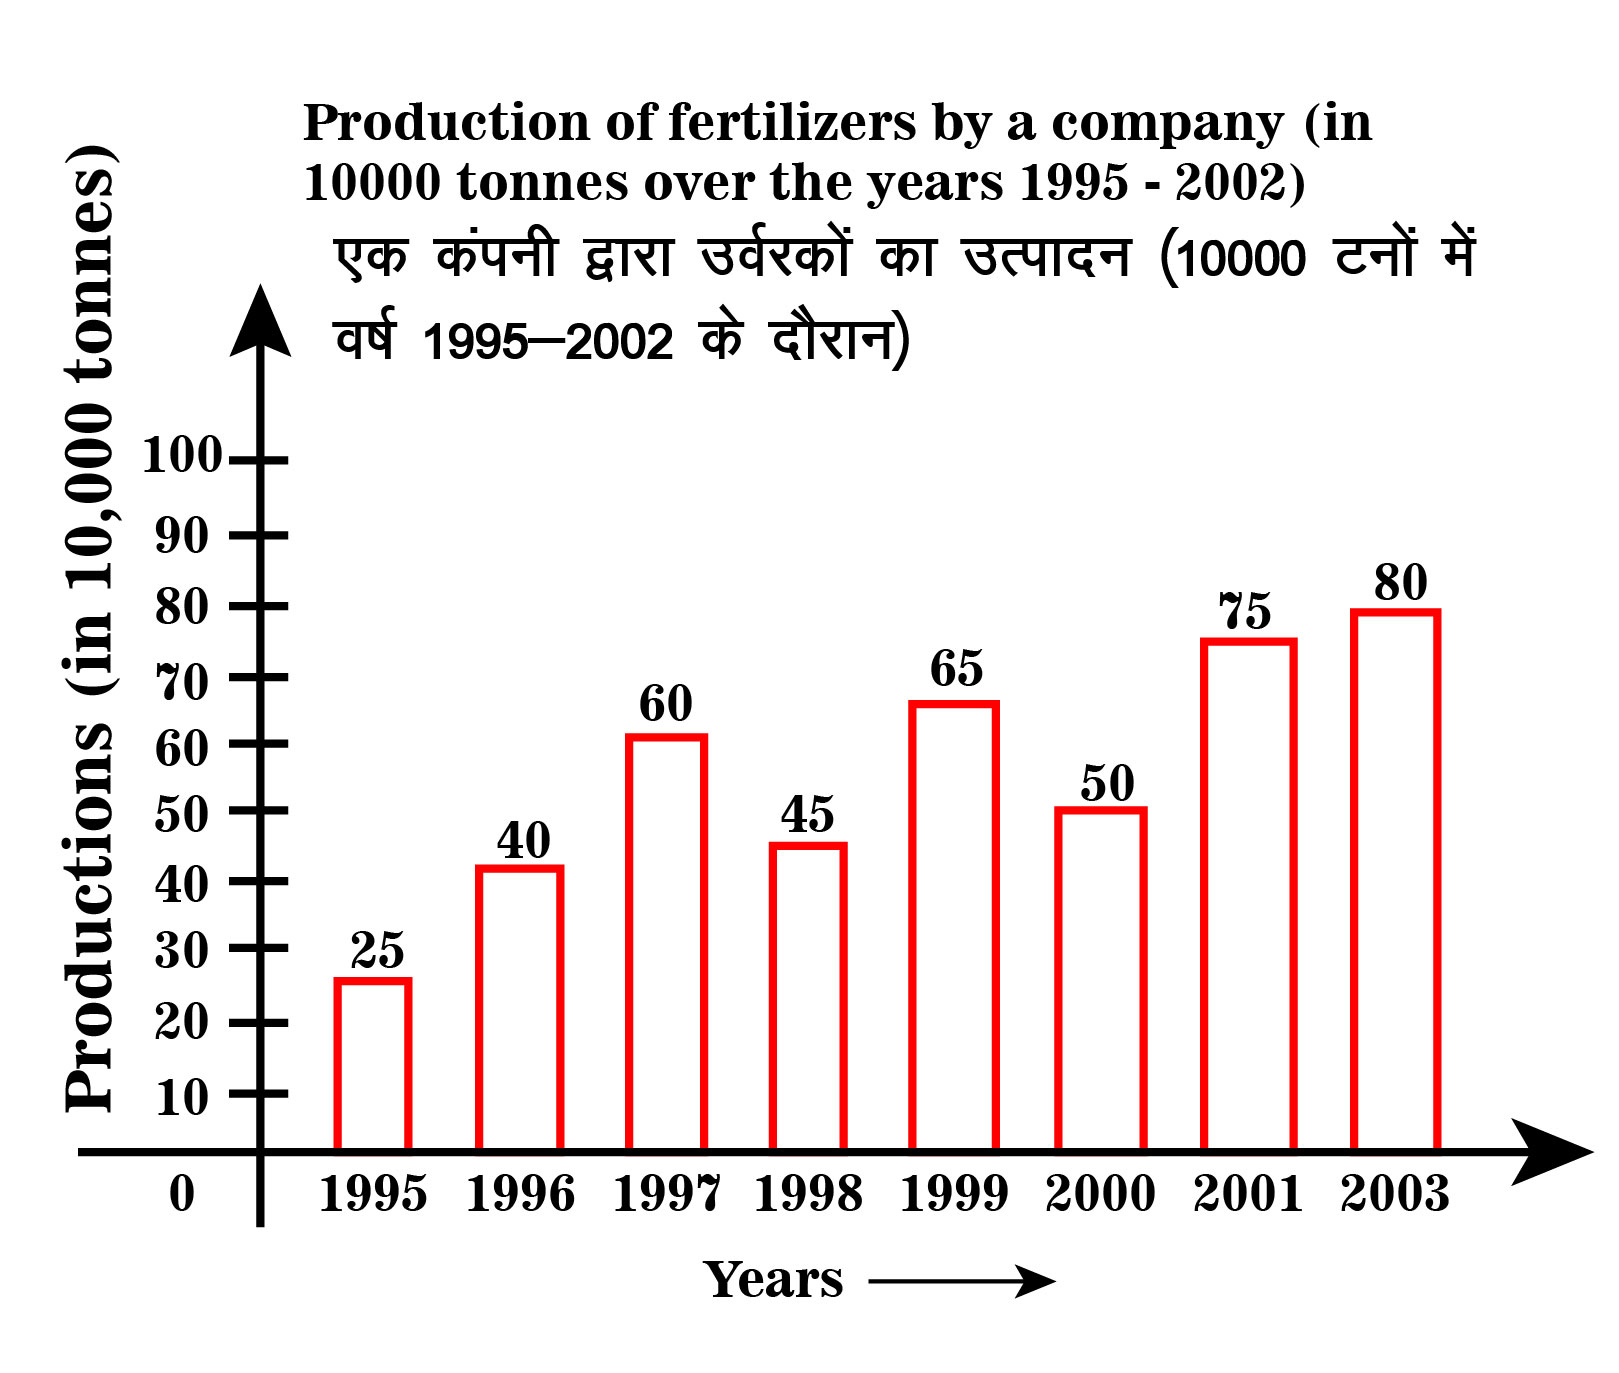
What was the percentage decline in the production of fertilizers from 1997 to 1998?
1446 05ea815c214fb314c31fe8e1e
5ea815c214fb314c31fe8e1e- 133%false
- 230%false
- 325%true
- 420%false
- 5None of thesefalse
- Show AnswerHide Answer
- Workspace
- SingleChoice
Answer : 3. "25%"
Q:Directions: Read the following table and answer the questions below it:
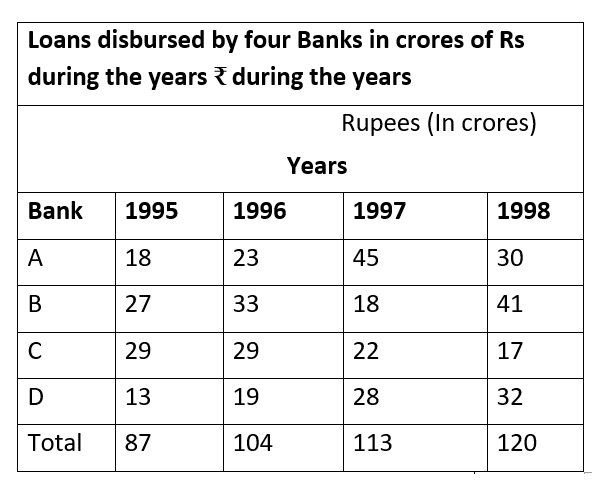
In which year the disbursement of loans by all the banks combined together was nearest to the average disbursement of loans over the years?
1446 05e4e4db01b69e805d0be9d01
5e4e4db01b69e805d0be9d01- 11995false
- 21996true
- 31997false
- 41998false
- Show AnswerHide Answer
- Workspace
- SingleChoice
Answer : 2. "1996 "
Q:Study the following table carefully and answer the questions given below.
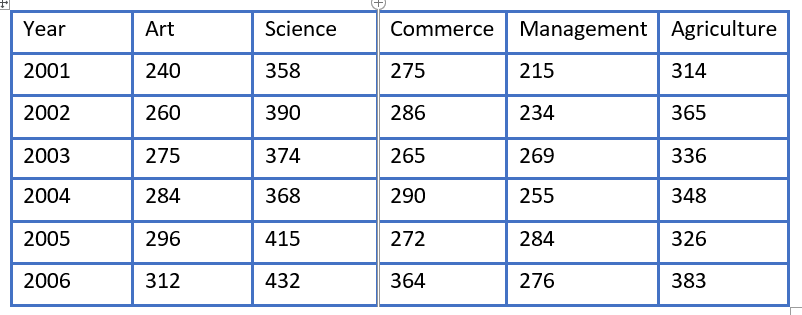
In which year the percentage change in the case of Agriculture discipline was highest from the previous year?
1445 05da0511f31905d285336376e
5da0511f31905d285336376e- 12002false
- 22003false
- 32004false
- 42005false
- 52006true
- Show AnswerHide Answer
- Workspace
- SingleChoice
Answer : 5. "2006"
Q:A bar graph shows unit production and unit sold of the different type of mobile company A, B, C, D E and F. Study the bar graph and give the answer of following questions.
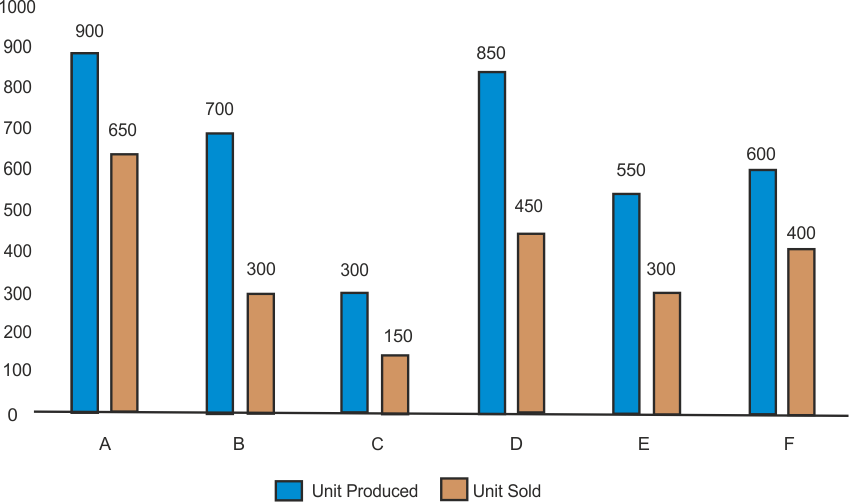
Which mobile company have the maximum difference between the unit produced and unit sold.
1445 05e213d20ac282f4217111c06
5e213d20ac282f4217111c06- 1A, Bfalse
- 2B, Afalse
- 3C, Dfalse
- 4B, Dtrue
- Show AnswerHide Answer
- Workspace
- SingleChoice
Answer : 4. "B, D"
Q:Direction: Study the following table carefully to answer these questions.
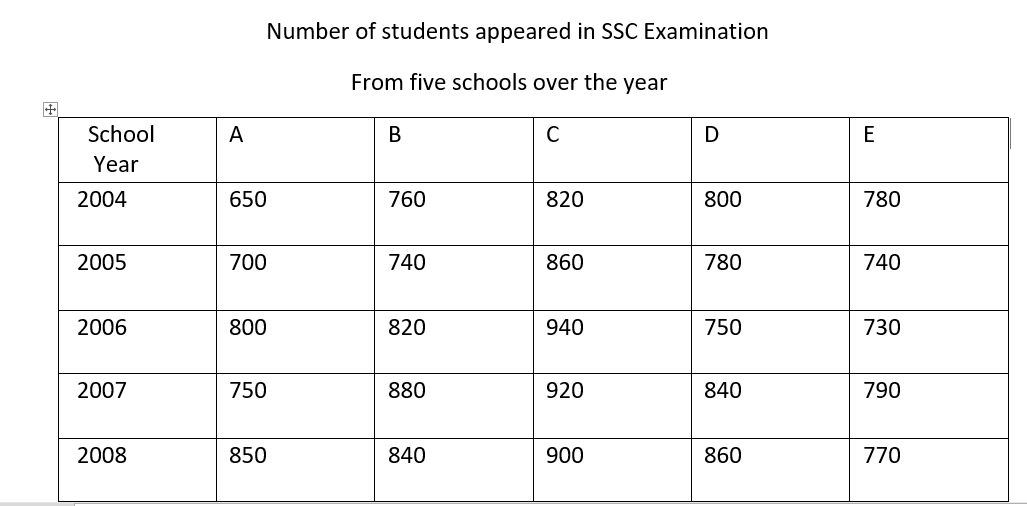
What is the average number of students appeared from all the schools in 2007?
1438 05e6c6b68b8843673942ab1b5
5e6c6b68b8843673942ab1b5- 1842false
- 2856false
- 3836true
- 4830false
- 5None of the abovefalse
- Show AnswerHide Answer
- Workspace
- SingleChoice
Answer : 3. "836"
Q:A bar graph showing the height of six mountain peaks. Study the bar graph and answer the following Questions.
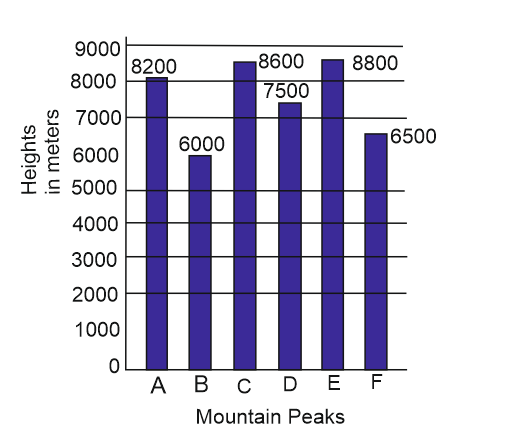
How much percentage is more than Peak A From Peak F?
1437 05f06e025b13c2d244adab39a
5f06e025b13c2d244adab39a- 1$$ {26}{4\over13}\%$$false
- 2$$ {26}{2\over13}\%$$true
- 3$$ {26}{8\over13}\%$$false
- 416 %false
- Show AnswerHide Answer
- Workspace
- SingleChoice
Answer : 2. "$$ {26}{2\over13}\%$$"
Q:The following penalty diagram shows the 4 year exam results of the students of 10th standard. Study the diagram and answer the following questions.
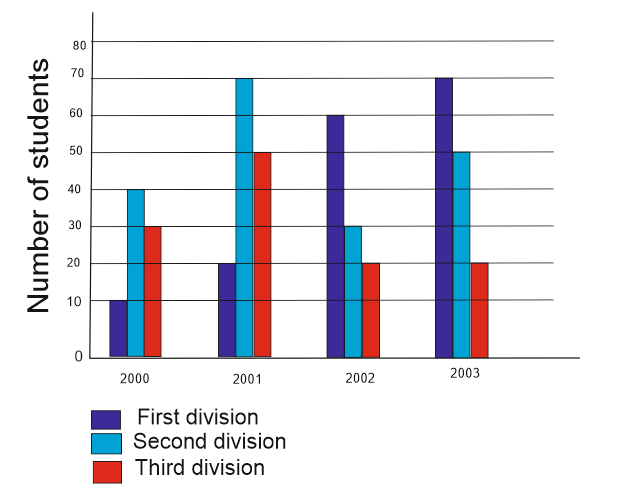
What is the ratio of the total students who have attained second division in the year 2000 and appeared in the examination?
1433 05dd4def57780ee3551584a51
5dd4def57780ee3551584a51- 11:4true
- 21:3false
- 33:4false
- 41:2false
- Show AnswerHide Answer
- Workspace
- SingleChoice