Data Interpretation Practice Question and Answer
8 Q:Directions: The bar chart given below shows the percentage distribution of the production of various models of a mobile manufacturing company in 2007 and 2008. The total production in 2007 was 35 lakh mobile phones and in 2008 the production was 44 lakh. Study the chart and answer the following questions.
Percentage of six different types of mobiles manufactured by a company over two year
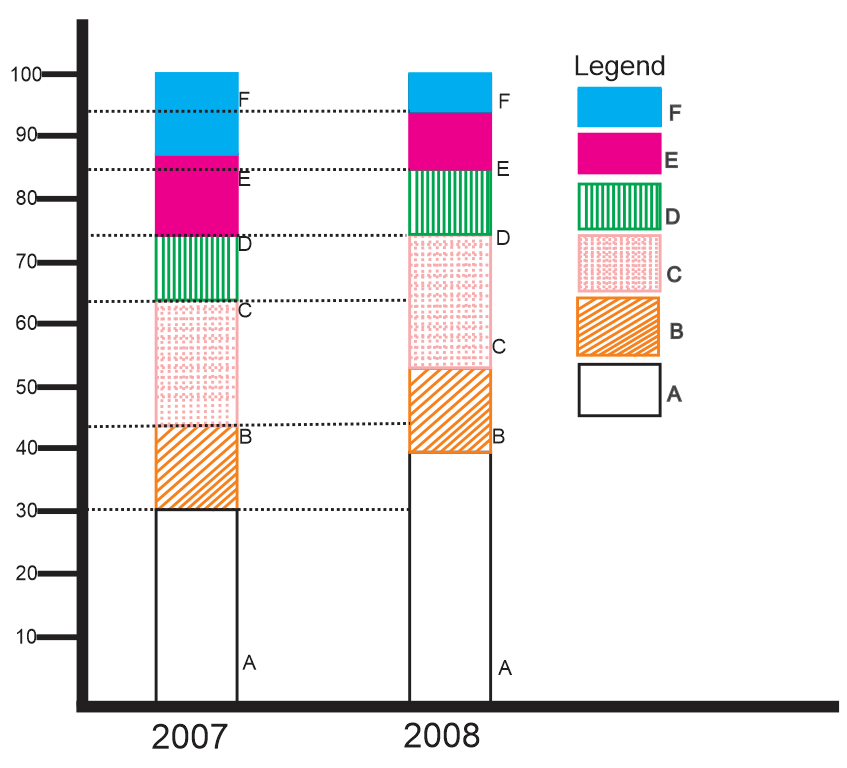
Total number of mobiles of models A, B and E manufactured in 2007 was
1411 05dd6828a00a9284b722e987b
5dd6828a00a9284b722e987bPercentage of six different types of mobiles manufactured by a company over two year
- 124,50,000false
- 222,75,00false
- 321,00,000true
- 419,25,00false
- Show AnswerHide Answer
- Workspace
- SingleChoice
Answer : 3. "21,00,000 "
Q:Pie chart shows the percent of money spent by family on various item during 1999. Study the graph and answer these questions.
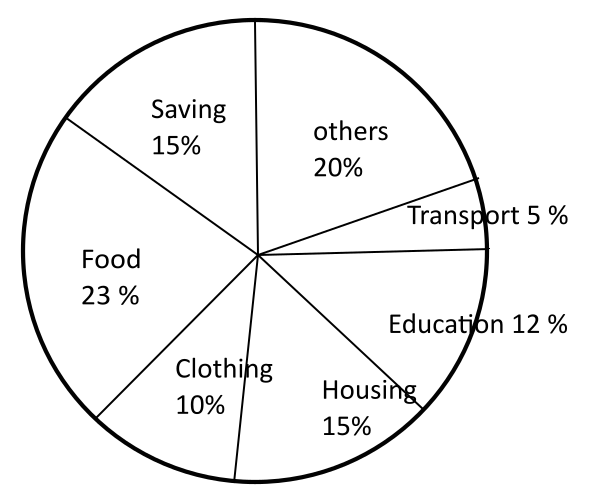
Graph shows that the maximum amount was spent on
1409 05fb4e5bfbf36696eb82682fb
5fb4e5bfbf36696eb82682fb- 1Foodtrue
- 2Clothingfalse
- 3Housingfalse
- 4Othersfalse
- Show AnswerHide Answer
- Workspace
- SingleChoice
Answer : 1. "Food"
Q:Direction: The following table represents the number of items sold by four divisions of a consumer goods dealer during 2010 to 2013.
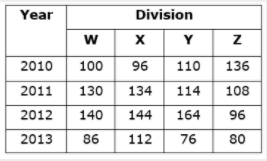
The combined sales figures in 2011 and 2013 of which division was the lowest?
1408 0603750bfcd43d04a8f4b0fdd
603750bfcd43d04a8f4b0fdd- 1Yfalse
- 2Wfalse
- 3Ztrue
- 4Xfalse
- Show AnswerHide Answer
- Workspace
- SingleChoice
Answer : 3. "Z"
Q:Direction : The table given below represents number of bikes of five different brands sold from 2001- 2005, with the help of data given in the table, answer the following questions.
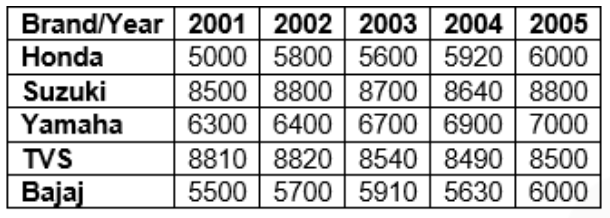
The average sale of Bajaj from 2001 to 2005 is what percentage of total sales of Suzuki from 2001-2005?
1407 060a4ef29b33a50608a41f7ff
60a4ef29b33a50608a41f7ff- 114%false
- 213.23%true
- 312.22%false
- 415.23%false
- 5None of thesefalse
- Show AnswerHide Answer
- Workspace
- SingleChoice
Answer : 2. "13.23%"
Q:Direction: Study the following graph and answer the given question.
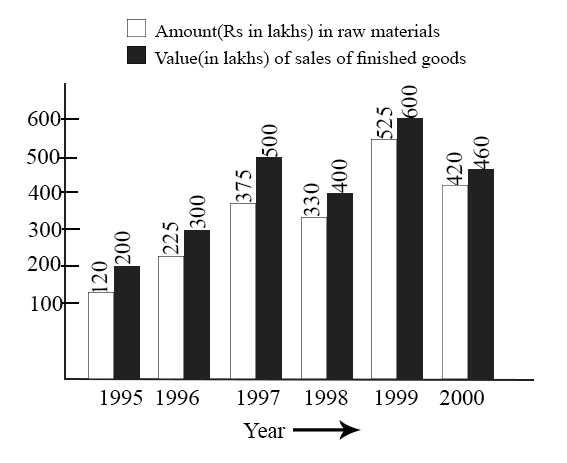
What was the difference between the average amount invested in raw materials during the given period and the average value of sales of finished goods during this period?
1406 05d9daefa82ff737fd6a8362d
5d9daefa82ff737fd6a8362d- 1Rs. 62.5 lakhfalse
- 2Rs. 68.5 lakhfalse
- 3Rs. 71.5 lakhfalse
- 4Rs. 77.5 lakhtrue
- Show AnswerHide Answer
- Workspace
- SingleChoice
Answer : 4. "Rs. 77.5 lakh"
Q:Directions: The bar graph shows the results of an annual examination in a secondary school in a certain year. Answer the following four questions based on this chart.

The ratio of the total number of boys passed to the total number of girls passed in the three classes VII, VIII and IX is
1406 05e8afb7167af633f22bd755c
5e8afb7167af633f22bd755c- 119 : 25false
- 221 : 26false
- 320 : 23true
- 418 : 21false
- Show AnswerHide Answer
- Workspace
- SingleChoice
Answer : 3. "20 : 23"
Q:A bar graph shows unit production and unit sold of the different type of mobile company A, B, C, D E and F. Study the bar graph and give the answer of following questions.
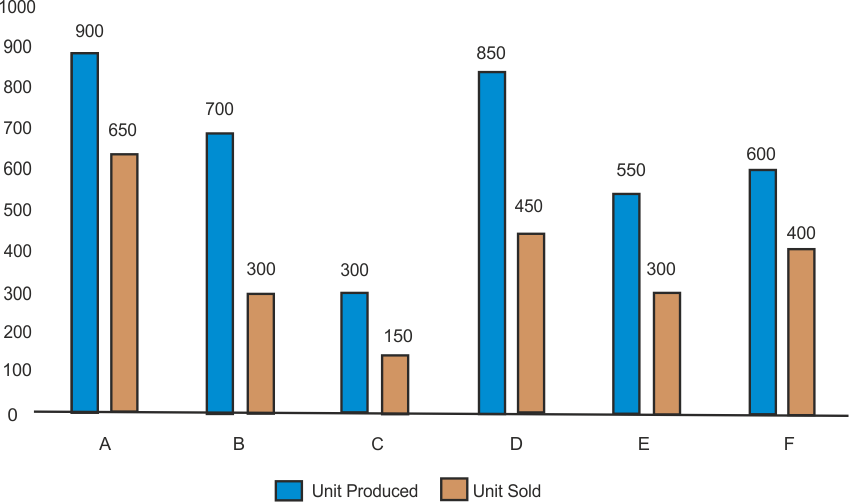
What is the difference between unit produced and unit sold of Mobile C Company?
1405 05e213c7d5f8f8e395f9076f7
5e213c7d5f8f8e395f9076f7- 1150true
- 2300false
- 3650false
- 4120false
- Show AnswerHide Answer
- Workspace
- SingleChoice
Answer : 1. "150"
Q: The following histogram shows the height of players of a basketball team of a school.
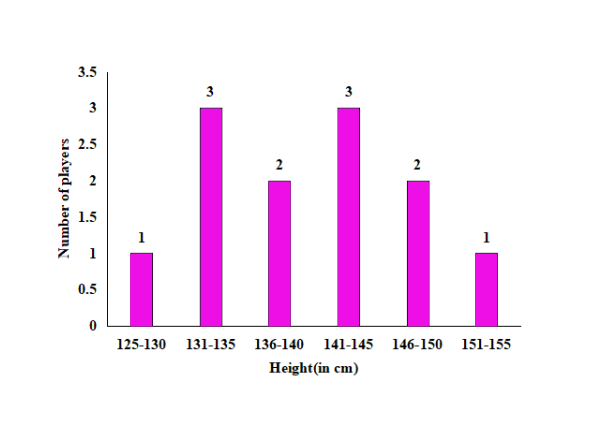
How many players have height less than 141 cm?
1404 06450d85b39143d085f373d2e
6450d85b39143d085f373d2e- 17false
- 24false
- 36true
- 45false
- Show AnswerHide Answer
- Workspace
- SingleChoice