Data Interpretation Practice Question and Answer
8 Q:Study the following graph carefully to answer the given questions
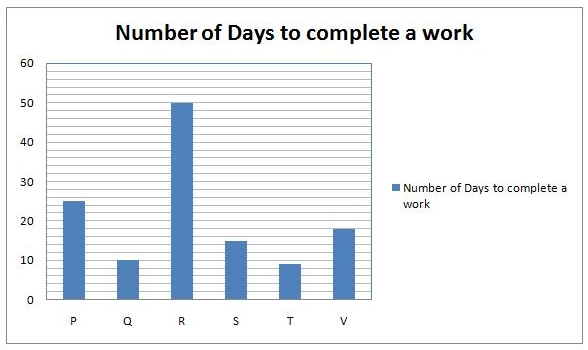
T and V started the work. After 3 days Z joined them, who can complete alone the same whole work in 3 days. What is the total number of days in which they had completed the work?
1402 05ea94139f197950c155cbe11
5ea94139f197950c155cbe11- 112false
- 28false
- 34true
- 46false
- 5None of thesefalse
- Show AnswerHide Answer
- Workspace
- SingleChoice
Answer : 3. "4"
Q:Directions: Study the bar-graph given below & answer the questions.
Pie-chart given below shows the percentage distribution of total no. of boys in six different Schools.
Total Boys in all schools together = 6400
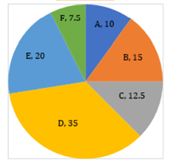
Total student in another school H is 250% more than the boys in school B and ratio of boys to girls in school H is 1 : 2. Then find number of boys in school H?
1400 05e93df499255c93bdf02671c
5e93df499255c93bdf02671cPie-chart given below shows the percentage distribution of total no. of boys in six different Schools.
Total Boys in all schools together = 6400
- 11140false
- 2None of thesefalse
- 31120true
- 41040false
- 51210false
- Show AnswerHide Answer
- Workspace
- SingleChoice
Answer : 3. "1120"
Q:The line graph shows the number of vacancies of accountants in a certain company. Study the diagram and answer the following questions.
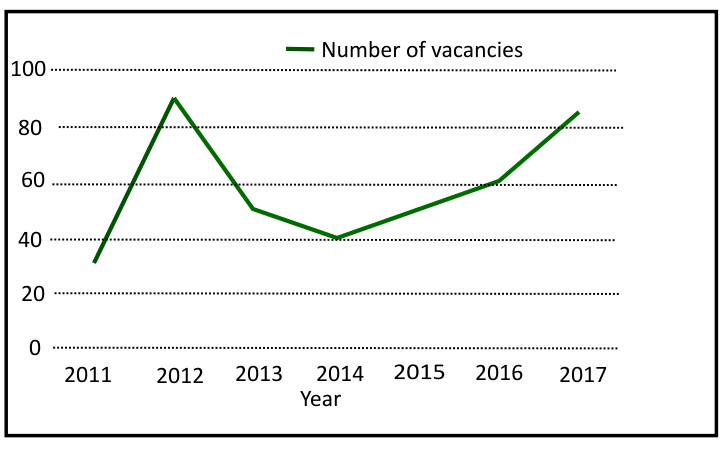
What is the different between maximum and minimum vacancies?
1399 05f5b0e26dc518b408a4241fc
5f5b0e26dc518b408a4241fc- 130false
- 260true
- 380false
- 440false
- Show AnswerHide Answer
- Workspace
- SingleChoice
Answer : 2. "60"
Q:Directions : Study the following frequency polygon and answer the questions. Given a line graph showing the number of students passed in Higher Secondary Examination in a school over the years 2008 to 2013.

The increase in percentage of passed students from 2008 to 2011 approximately is
1398 06393215bd319b37ca19bd755
6393215bd319b37ca19bd755- 155%false
- 250.5%false
- 354.5%true
- 453.05%false
- Show AnswerHide Answer
- Workspace
- SingleChoice
Answer : 3. "54.5% "
Q:Study the following graph carefully to answer the given questions
A is twice efficient as B and together they do the same work in as much time as T and V together. In how many days A can complete the work individually?
1398 05ea941a707542b13ae2c1c55
5ea941a707542b13ae2c1c55- 15 daysfalse
- 28 daysfalse
- 34 daysfalse
- 49 daystrue
- 5None of thesefalse
- Show AnswerHide Answer
- Workspace
- SingleChoice
Answer : 4. " 9 days"
Q:Directions: The line graph shows the number of work visas issued by a country in each year from 2011 to 2016. Study the diagram and answer the following questions .
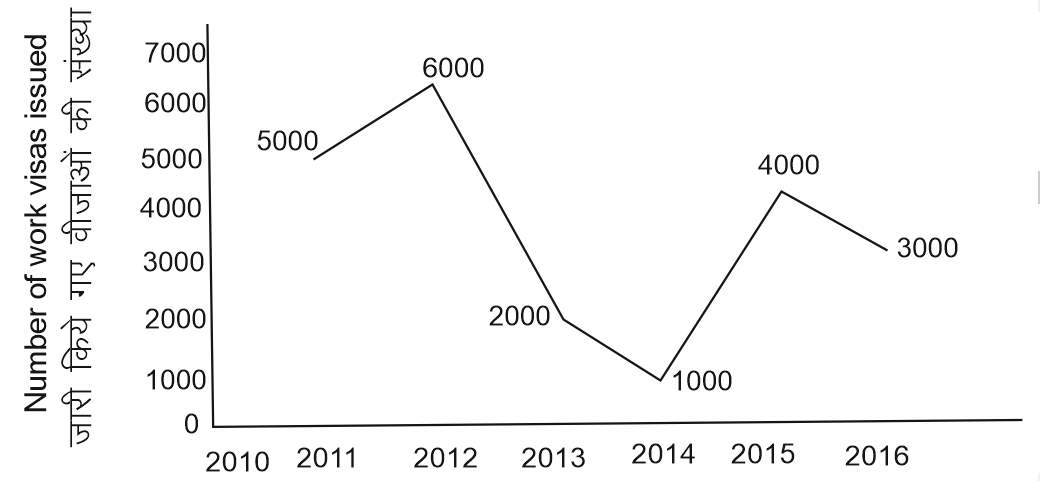
If 10 % of people who are issued work visas do not use the visas , then how many people from 2011 to 2016 have used the visas ?
1398 05ed9efe0f528050f91504f7e
5ed9efe0f528050f91504f7e- 119800false
- 27800false
- 318700false
- 418900true
- Show AnswerHide Answer
- Workspace
- SingleChoice
Answer : 4. "18900"
Q:Directions : The graph shows the demand and production of different companies. Study the graph and answer the following questions.
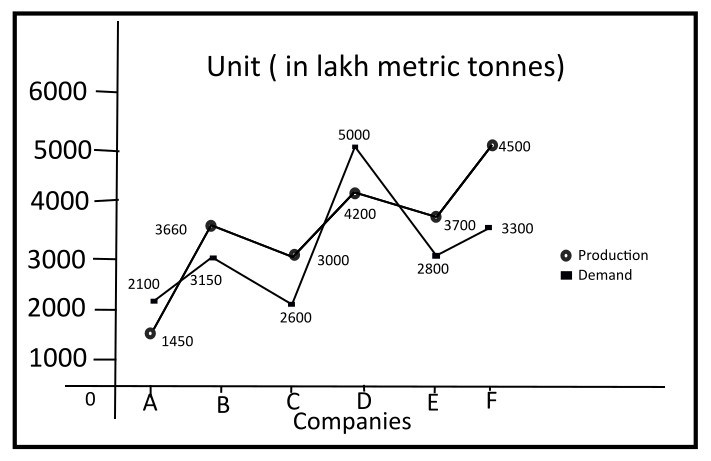
What is the second large demand company?
1396 05f4f730882a7582d892c7ab9
5f4f730882a7582d892c7ab9- 1Ftrue
- 2Bfalse
- 3Afalse
- 4Dfalse
- Show AnswerHide Answer
- Workspace
- SingleChoice
Answer : 1. "F"
Q:Direction: The given Bar Graph Presents the number of different types of vehicles (in lakhs) exported by a company during 2014 and 2015.
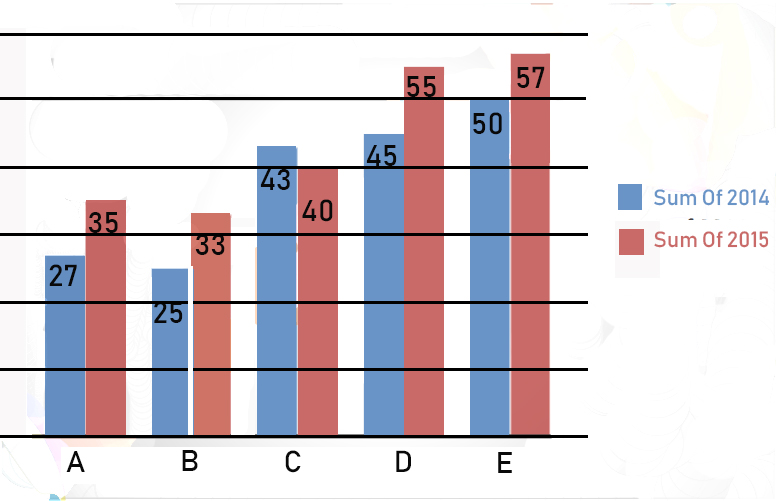
The average number type A, B and D vehicles exported in 2015 was x% less than the number of type E vehicles exported in 2014. What is the value of x?
1395 0602514ac083f2c6596c29b5d
602514ac083f2c6596c29b5d- 120false
- 225false
- 318true
- 424false
- Show AnswerHide Answer
- Workspace
- SingleChoice