Data Interpretation Practice Question and Answer
8 Q:The given pie chart shows the percentage of students enrolled for the courses A, B, C, D and E in a university and the table shows the percentage of students that passed, out of the enrolled students.
Total Students=60,000
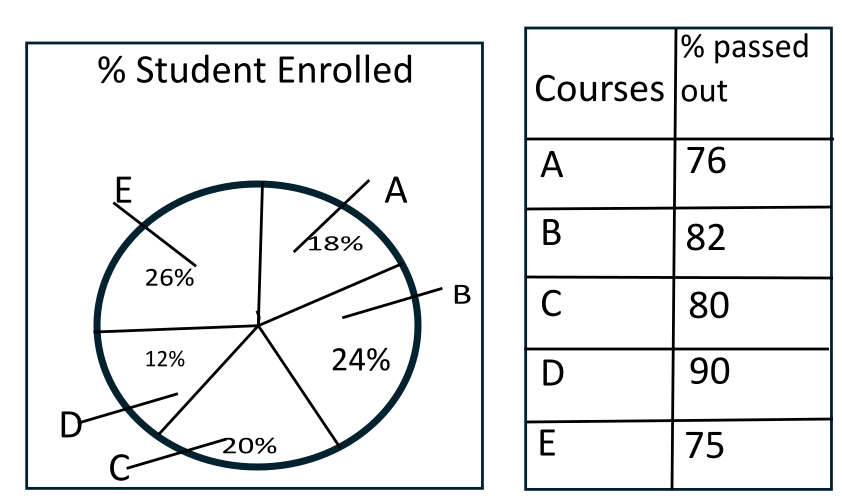
How many students passed in Course B?
1475 05ffc353523210f22f330372a
5ffc353523210f22f330372aTotal Students=60,000
- 12512false
- 22490true
- 32392false
- 42592false
- Show AnswerHide Answer
- Workspace
- SingleChoice
Answer : 2. "2490"
Q:The given pie chart shows the percentage of students enrolled for the courses A, B, C, D and E in a university and the table shows the percentage of students that passed, out of the enrolled students.
Total Students=60,000
If the total number of students is 60,000, then the total number of students who did not pass in the course A, C is:
1448 05ffc34c3b78a0253d6ee6529
5ffc34c3b78a0253d6ee6529Total Students=60,000
- 17628false
- 24992true
- 38253false
- 47852false
- Show AnswerHide Answer
- Workspace
- SingleChoice
Answer : 2. "4992"
Q:Directions: Study the following table carefully to answer the questions that follow Number of Gold coins (in hundred) produced in Five Different companies during Six Different month.
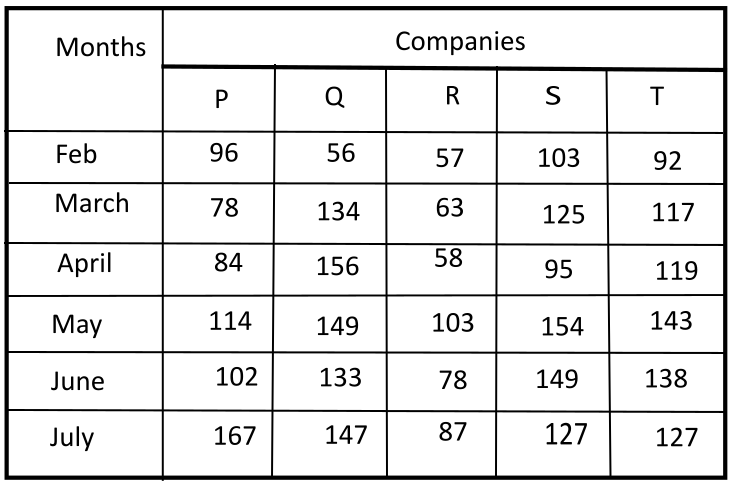
Number of Gold coins produced from company R in the month May was approximately what percentage of the number of Gold coins produced in the company T in the month March?
1135 05fd9c8b389d4575ab490d7db
5fd9c8b389d4575ab490d7db- 185true
- 295false
- 360false
- 440false
- 575false
- Show AnswerHide Answer
- Workspace
- SingleChoice
Answer : 1. "85 "
Q:Directions: Study the following table carefully to answer the questions that follow Number of Gold coins (in hundred) produced in Five Different companies during Six Different month.
In which Company was the number of Gold coins produced out in the month May highest?
1197 05fd9c85f079b5044b465478a
5fd9c85f079b5044b465478a- 1Qfalse
- 2Pfalse
- 3Tfalse
- 4Strue
- 5Rfalse
- Show AnswerHide Answer
- Workspace
- SingleChoice
Answer : 4. "S "
Q:Directions: Study the following table carefully to answer the questions that follow Number of Gold coins (in hundred) produced in Five Different companies during Six Different month.
In which company the number of the Gold coins continuously increased during the year February to July?
1118 05fd9c802ee21a5440627e524
5fd9c802ee21a5440627e524- 1Only R and Tfalse
- 2Only Qfalse
- 3Only Pfalse
- 4Only Q and Tfalse
- 5None of thesetrue
- Show AnswerHide Answer
- Workspace
- SingleChoice
Answer : 5. "None of these"
Q:Directions: Study the following table carefully to answer the questions that follow Number of Gold coins (in hundred) produced in Five Different companies during Six Different month.
What was the total number of Gold coins produced from all the companies together in the month of march?
1318 05fd9c7a489d4575ab490c20a
5fd9c7a489d4575ab490c20a- 153500false
- 251700true
- 35.15 thousandfalse
- 451500false
- 5None of thesefalse
- Show AnswerHide Answer
- Workspace
- SingleChoice
Answer : 2. "51700"
Q:Directions: Study the following table carefully to answer the questions that follow Number of Gold coins (in hundred) produced in Five Different companies during Six Different month.
What was the respective ratio between the number of Gold coins produced from company P in the month may and the number of Gold coins produced from company T in the month June?
1378 05fd9c743bc259a5735cb4d76
5fd9c743bc259a5735cb4d76- 138 : 41false
- 223 : 21true
- 319 : 21false
- 419 : 23false
- 5None of thesefalse
- Show AnswerHide Answer
- Workspace
- SingleChoice
Answer : 2. "23 : 21 "
Q:Study the following bar chart and answer the questions carefully.
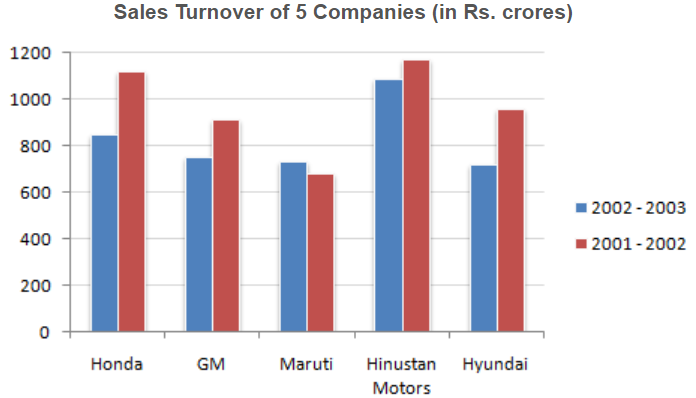
What is the approximate difference between the average sales turnover of all the companies put together between the years 2001 - 2002 and 2002 - 2003 ?
1746 05fd34333531d336d4b4e9e07
5fd34333531d336d4b4e9e07- 1133.45false
- 2142.48true
- 3117.6false
- 4115.25false
- 5None of thesefalse
- Show AnswerHide Answer
- Workspace
- SingleChoice