Data Interpretation Practice Question and Answer
8 Q: Study the following graph and answer the question that follow.
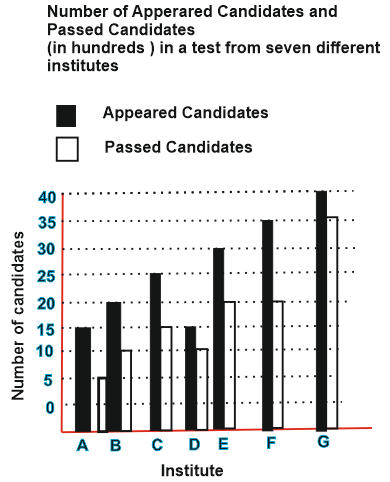
What is the approximate average number of candidates passed from all the institutes together?
3529 05d860d36a08f7a4080524b13
5d860d36a08f7a4080524b13What is the approximate average number of candidates passed from all the institutes together?
- 11460false
- 21640true
- 31350false
- 41440false
- 51530false
- Show AnswerHide Answer
- Workspace
- SingleChoice
Answer : 2. "1640"
Q:Direction: The line chart given below shows the number of labors (men and women) working in six different years. Study the data carefully and answer the following questions.
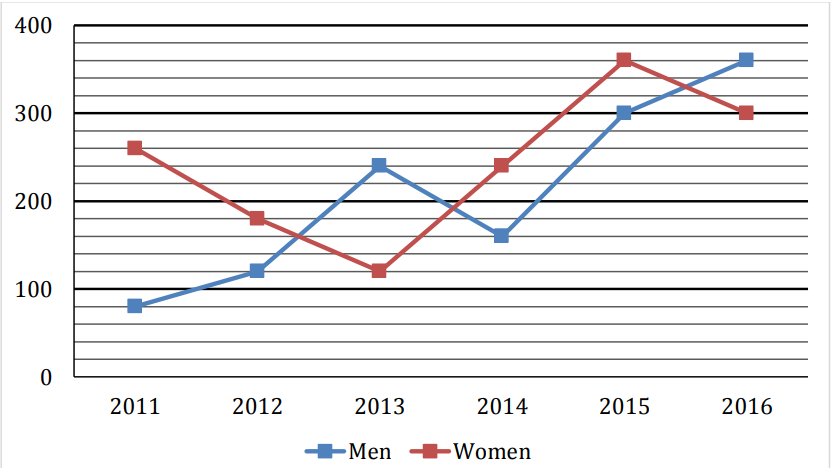
Total number of Men working in 2012 and 2013 together is what percent of the total number of labors (Men + Women) working in 2014?
3454 0603dc62fcd43d04a8f5c9fc0
603dc62fcd43d04a8f5c9fc0- 190%true
- 240%false
- 360%false
- 470%false
- 580%false
- Show AnswerHide Answer
- Workspace
- SingleChoice
Answer : 1. "90% "
Q:Directions: The Bar Graph given here shows the population (in crores) of India in various census years. Observe the graph and answer the question based on it.
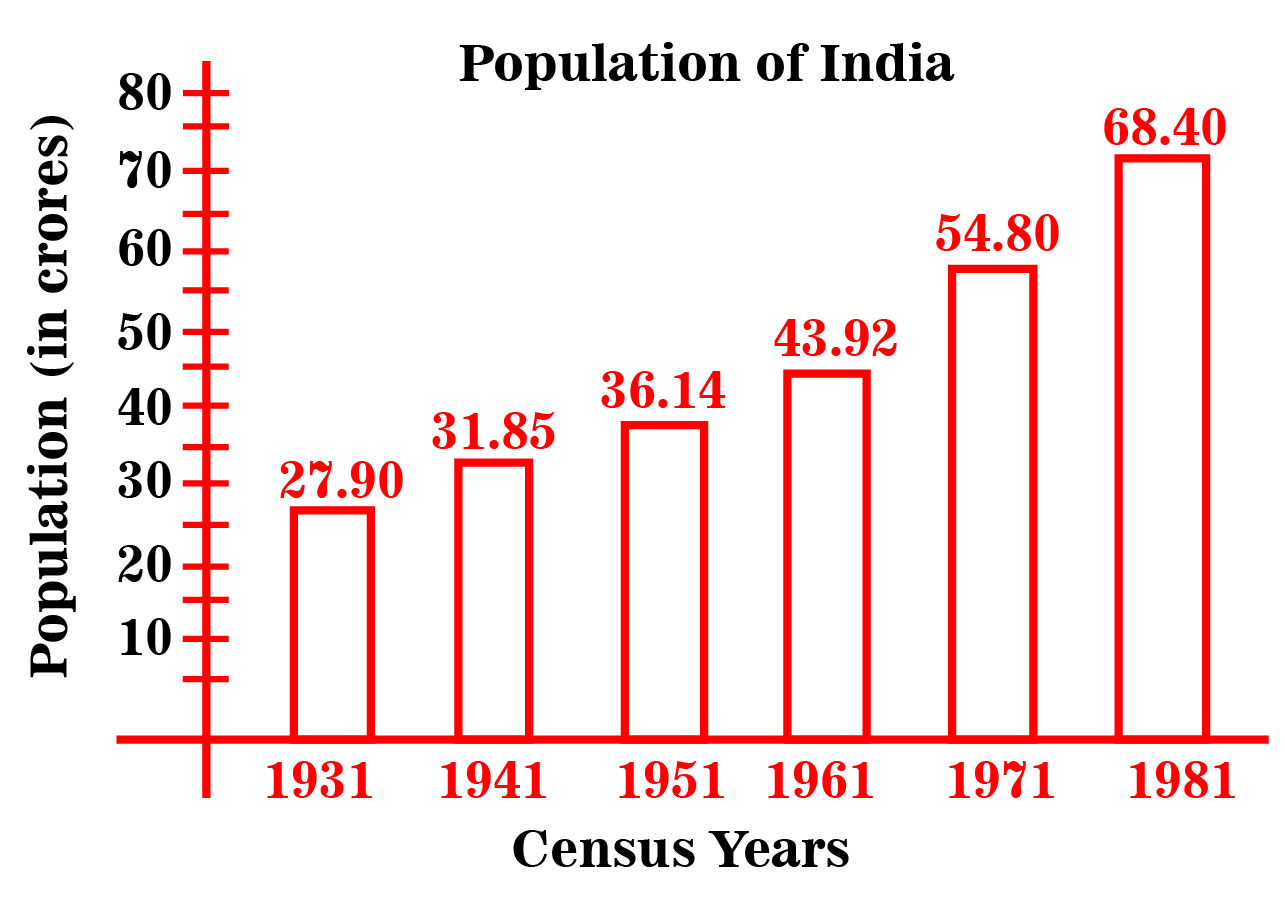
Per year increase in population from the year 1931 to 1981 is
3367 05ea8124ec8dec64c00978d98
5ea8124ec8dec64c00978d98- 18100000true
- 27600000false
- 38900000false
- 46700000false
- 5None of thesefalse
- Show AnswerHide Answer
- Workspace
- SingleChoice
Answer : 1. "8100000 "
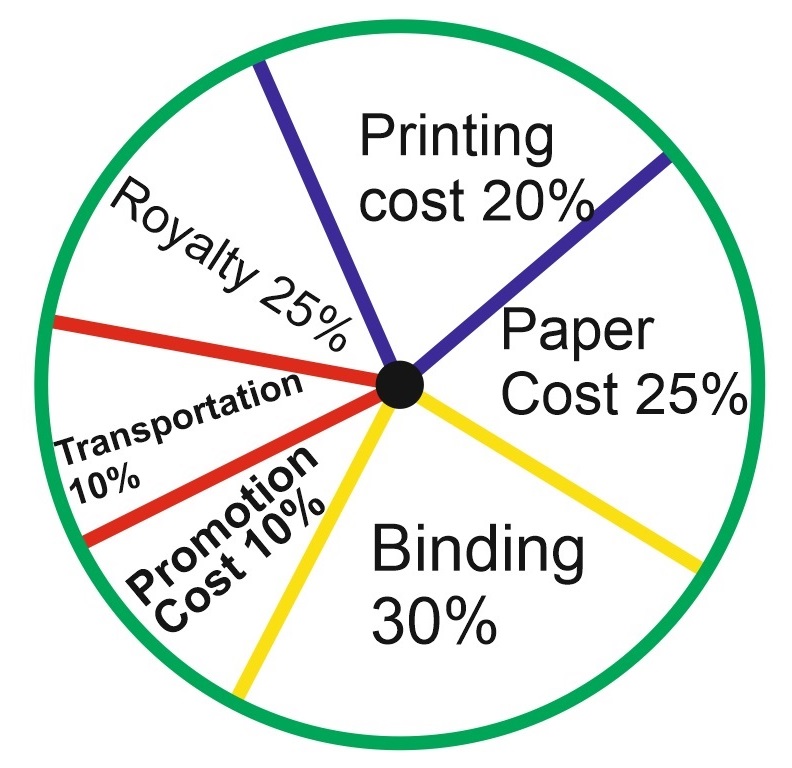
Q: Royalty on the book is less than the printing cost by :
3332 05d70ca559004b376a58bee7c
5d70ca559004b376a58bee7c
- 15 %false
- 210 %false
- 320 %false
- 425 %true
- Show AnswerHide Answer
- Workspace
- SingleChoice
Answer : 4. "25 %"
Explanation :
Printing Cost of book = 20% of C.P.
Royalty on book = 15% of C.P
Difference = (20% of C.P) – (15% of C.P) = 5% of C.P.
⸫ Percentage difference = ![]()
= ![]() = 25% = 25%
= 25% = 25%
Thus, Royalty on the book is 25% less than the printing Cost.
Q: The following pie-chart shows the study-time of different subject of a student in a day. Study the pie chart and answer the following questions.The time spent to study history and chemistry is 4 hours 30 minutes, Then the student studies Physics for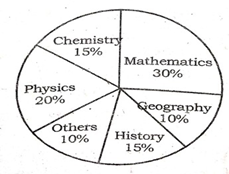
3095 05d1ef9b8c068c021a4048f2a
5d1ef9b8c068c021a4048f2a- 11 hourfalse
- 22.9 hourfalse
- 32 hourfalse
- 43 hourstrue
- Show AnswerHide Answer
- Workspace
- SingleChoice
Answer : 4. "3 hours"
Q:Direction: Study the double bar graph given below and answer the questions.
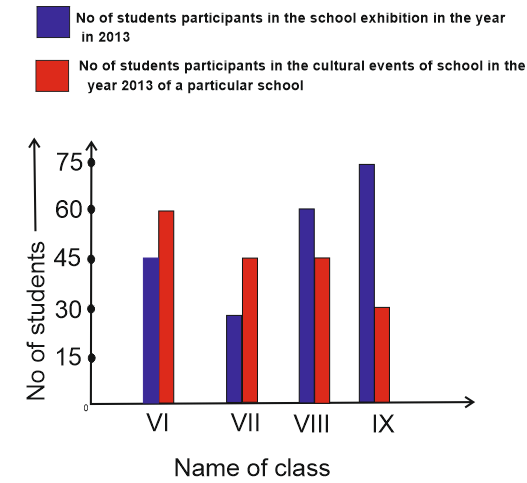
The average of the number of students participating in cultural events is:
3078 05d9321e7c263b979273f36b1
5d9321e7c263b979273f36b1- 148.75false
- 252.5false
- 345true
- 450false
- Show AnswerHide Answer
- Workspace
- SingleChoice
Answer : 3. "45"
Q: The following pie-chart shows the study-time of different subject of a student in a day. Study the pie chart and answer the following questions.If the student studies 10 hours in a day, then he/she studies mathematic for

3057 05d1efdb5c068c021a4048f34
5d1efdb5c068c021a4048f34- 13 hourtrue
- 210/3 hourfalse
- 31/3 hourfalse
- 43/10 hourfalse
- Show AnswerHide Answer
- Workspace
- SingleChoice
Answer : 1. "3 hour"
Q:Study the following graph to answer these questions :
Percent profit earned by two companies A & B over the years.
Profit = Income – Expenditure
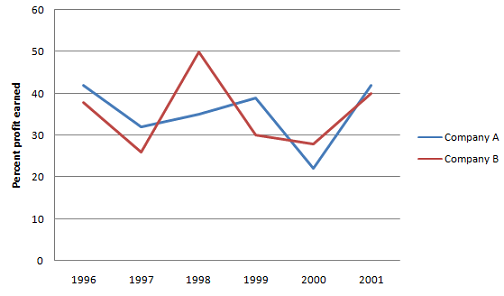
If the expenditure of Company A in 1997 was Rs.70 lakhs and income of Company A in 1997 was equal to its expenditure in 1998, what was the total income (in Rs. lakh) of the Company A in 1997 & 1998 together?
2955 05e79ab3f8560ba13b0276082
5e79ab3f8560ba13b0276082Percent profit earned by two companies A & B over the years.
Profit = Income – Expenditure
- 1175false
- 2131.25false
- 3218.75true
- 4Cannot be determinedfalse
- 5None of thesefalse
- Show AnswerHide Answer
- Workspace
- SingleChoice