Data Interpretation Practice Question and Answer
8 Q:In the following diagram, three different products (in thousands) produced by a company in 5 years are given and after studying them carefully, answer the following questions.
Three products produced by a company in different years (in thousands)
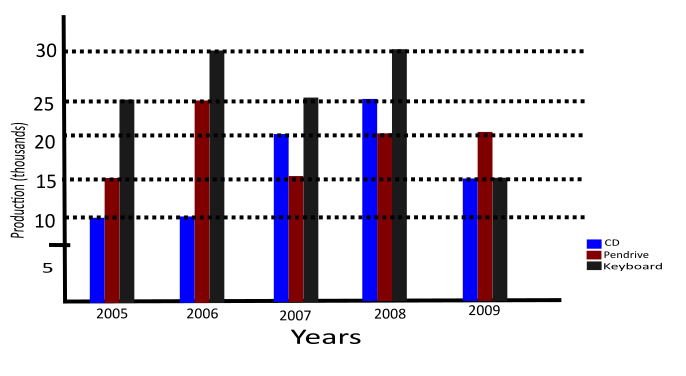
What is the average number of pan-drives produced by the company in all the years?
1085 05faa5d67ece37f513633591b
5faa5d67ece37f513633591b- 132,000false
- 221,000true
- 334,000false
- 410,500false
- Show AnswerHide Answer
- Workspace
- SingleChoice
Answer : 2. "21,000"
Q:The following chart depicts the percentage of Educated and Uneducated men and women in a city with a population of 2,50,000.
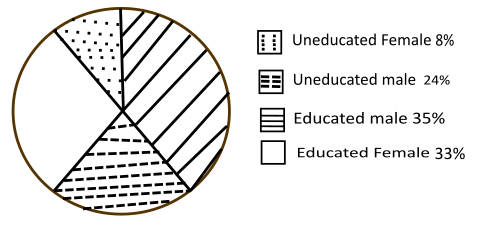
How many of these women are Uneducated?
1412 05f9f9c064a02db7b99b229e3
5f9f9c064a02db7b99b229e3- 120,000true
- 235,000false
- 340,000false
- 425,000false
- Show AnswerHide Answer
- Workspace
- SingleChoice
Answer : 1. "20,000"
Q:The following chart depicts the percentage of Educated and Uneducated men and women in a city with a population of 2,50,000.
Differentiate between the number of Educated males and Educated females.
1420 05f9f9b8cd265227c88cdde25
5f9f9b8cd265227c88cdde25- 15,000true
- 2500false
- 375,000false
- 41,500false
- Show AnswerHide Answer
- Workspace
- SingleChoice
Answer : 1. "5,000"
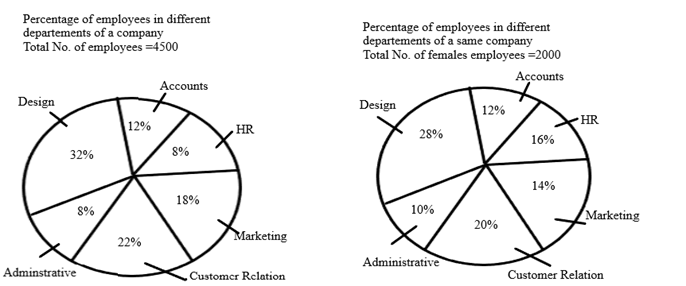
Q: The total number of females are what percent of the total number of males in the organization?
20547 35d4abda611160f205237578e
5d4abda611160f205237578e- 190false
- 270false
- 380true
- 460false
- 5None of thesefalse
- Show AnswerHide Answer
- Workspace
- SingleChoice
Answer : 3. "80"
Q:The following table shows the number of units of product produced and sold by a company during six years.
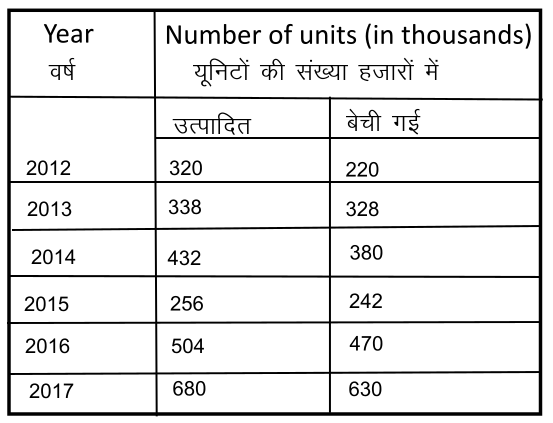
What is the difference between the number of units produced in 2017 and the number of units sold in 2014?
1323 05f6d9bcdf9079a64e3bfd8e6
5f6d9bcdf9079a64e3bfd8e6- 1320false
- 2340false
- 390false
- 4300true
- Show AnswerHide Answer
- Workspace
- SingleChoice
Answer : 4. "300"
Q:The following table shows the number of units of product produced and sold by a company during six years.
In which two years were the maximum units sold?
1467 05f6d9b77ec13dd7480045efe
5f6d9b77ec13dd7480045efe- 12013, 2017false
- 22016, 2017true
- 32013, 2014false
- 42015, 2017false
- Show AnswerHide Answer
- Workspace
- SingleChoice
Answer : 2. "2016, 2017"
Q:The following table shows the number of units of product produced and sold by a company during six years.
What is the percentage of the number of units produced in 2017 more than the number of units produced since 2012?
1264 05f6d9b315256e8407c2dd4ea
5f6d9b315256e8407c2dd4ea- 1114 %false
- 2112.5 %true
- 3114.25%false
- 4113 %false
- Show AnswerHide Answer
- Workspace
- SingleChoice
Answer : 2. "112.5 %"
Q:The following table shows the number of units of product produced and sold by a company during six years.
Find the ratio of the total number of units sold in 2013 and 2015 to the number of units sold in 2015 and 2016?
1505 05f6d9ac55256e8407c2dd134
5f6d9ac55256e8407c2dd134- 129 : 38false
- 214 : 19false
- 33 : 4true
- 47 : 9false
- Show AnswerHide Answer
- Workspace
- SingleChoice