Data Interpretation Practice Question and Answer
8 Q:Read the following graph carefully and answer the related questions-
Total number of students (in thousands) participating in comitative exam in various cities.
What is the percentage of students appearing in competitive exam from city E to total number of students appearing for competitive exam from all the states?
1152 060237c5aad295556282de836
60237c5aad295556282de836- 115false
- 217false
- 319false
- 421true
- Show AnswerHide Answer
- Workspace
- SingleChoice
Answer : 4. "21"
Q:Directions: Study the following information carefully and answer the questions given below.
In the table, the percentage of shirts (formal and casual) sold out of the total number of shirts sold in the week and the number of casual shirts sold data related to the number of shirts sold on ve weekdays – Monday, Tuesday, Wednesday, Thursday and Friday are given.
Total number of shirts sold in the week = x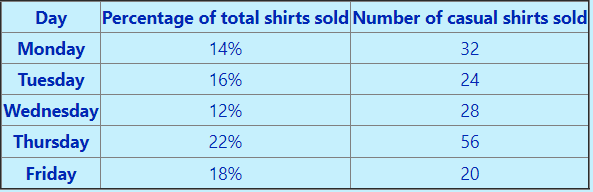 Note: Total number of shirts sold on Saturday and Sunday together = 72
The number of casual shirts sold on Thursday is what per cent more than the number of formal shirts sold on Tuesday?
1152 064e5ef6460749cb6f2e5fffd
64e5ef6460749cb6f2e5fffdIn the table, the percentage of shirts (formal and casual) sold out of the total number of shirts sold in the week and the number of casual shirts sold data related to the number of shirts sold on ve weekdays – Monday, Tuesday, Wednesday, Thursday and Friday are given.
Note: Total number of shirts sold on Saturday and Sunday together = 72- 120%false
- 250%false
- 340%true
- 437.5%false
- 5None of thesefalse
- Show AnswerHide Answer
- Workspace
- SingleChoice
Answer : 3. "40%"
Q:Directions: Study the bar-graph given below & answer the questions.
Pie-chart given below shows the percentage distribution of total no. of boys in six different Schools.
Total Boys in all schools together = 6400
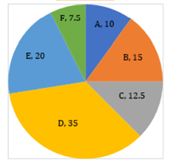
What is the average of total no. of boys in school A, C and F?
1151 05e93de443d193e3bf6fdbdff
5e93de443d193e3bf6fdbdffPie-chart given below shows the percentage distribution of total no. of boys in six different Schools.
Total Boys in all schools together = 6400
- 1640true
- 2680false
- 3720false
- 4None of thesefalse
- 5540false
- Show AnswerHide Answer
- Workspace
- SingleChoice
Answer : 1. "640"
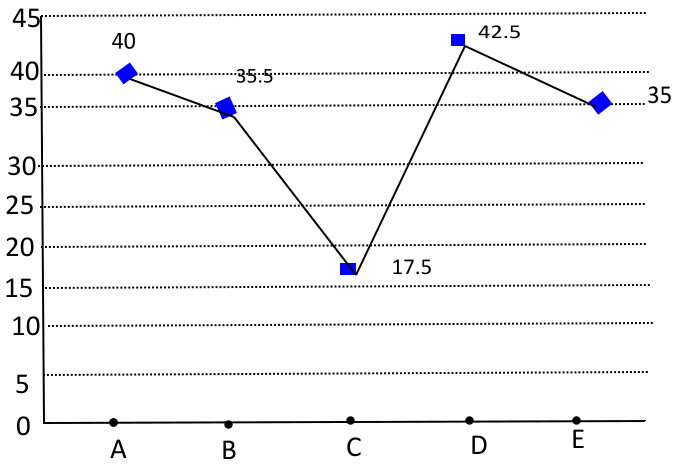
Q:Study the following graph carefully to answer the given questions
After working for 3 days S is joined by O. If they complete the remaining work in 3 more days, in how many days can O alone complete the work?
1150 05ea9428a3dbbdc76195ae47f
5ea9428a3dbbdc76195ae47f- 110 daysfalse
- 28 daysfalse
- 35 daystrue
- 412 daysfalse
- 515 daysfalse
- Show AnswerHide Answer
- Workspace
- SingleChoice
Answer : 3. "5 days"
Q:Direction: The following table shows the number of students of 7 colleges A, B, C, D, E, F, G participating in extra-curricular activities :
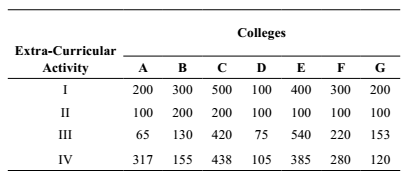
The college in which minimum number of students participate in extracurricular activities is ?
1149 06011472caf82aa3010a2f6a7
6011472caf82aa3010a2f6a7- 1Dtrue
- 2Gfalse
- 3Ffalse
- 4Afalse
- Show AnswerHide Answer
- Workspace
- SingleChoice
Answer : 1. "D "
Q:Direction: Study the following table carefully and answer the given questions. Table shows the of passed students in four schools and ratio between passed boys and girls among them. The ratio between failed boys and girls is reverse of passed ratio between them.
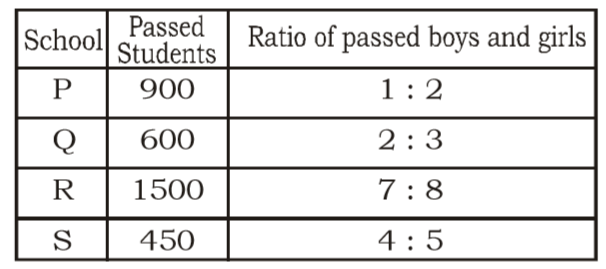
Find the approx average number of passed students in all the schools together.
1148 05e9d34e0bf0a265d837bd778
5e9d34e0bf0a265d837bd778- 1873false
- 2843false
- 3833false
- 4863true
- 5853false
- Show AnswerHide Answer
- Workspace
- SingleChoice
Answer : 4. "863 "
Q:The table given below shows the information about bats manufactured by 6 different companies. Each company manufactures only plastic and wooden bats. Each company labels these bats as Brand A or Brand B. The table shows the number of plastic bats as a percentage of total bats manufactured by each company. It also shows the ratio of wooden bats labelled A and B. Each company manufactured a total 550000 bats.

What is the total number of wooden bats of brand A manufactured by company T?
1148 05f30d291c006da57832960d6
5f30d291c006da57832960d6- 123,420false
- 222,990false
- 368,920false
- 472,600true
- Show AnswerHide Answer
- Workspace
- SingleChoice
Answer : 4. "72,600"
Q:Directions: Study the following information carefully and answer the questions given below.
In the table, the percentage of shirts (formal and casual) sold out of the total number of shirts sold in the week and the number of casual shirts sold data related to the number of shirts sold on ve weekdays – Monday, Tuesday, Wednesday, Thursday and Friday are given.
Total number of shirts sold in the week = x Note: Total number of shirts sold on Saturday and Sunday together = 72
What is the average number of total shirts sold on Wednesday, Friday, Saturday and Sunday together?
1144 064e5ed45de1aa1b70fd9c28f
64e5ed45de1aa1b70fd9c28fIn the table, the percentage of shirts (formal and casual) sold out of the total number of shirts sold in the week and the number of casual shirts sold data related to the number of shirts sold on ve weekdays – Monday, Tuesday, Wednesday, Thursday and Friday are given.
Note: Total number of shirts sold on Saturday and Sunday together = 72- 164false
- 224false
- 336false
- 448true
- 5None of thesefalse
- Show AnswerHide Answer
- Workspace
- SingleChoice