Data Interpretation Practice Question and Answer
8 Q:Directions: The line graph shows the number of work visas issued by a country in each year from 2011 to 2016. Study the diagram and answer the following questions .
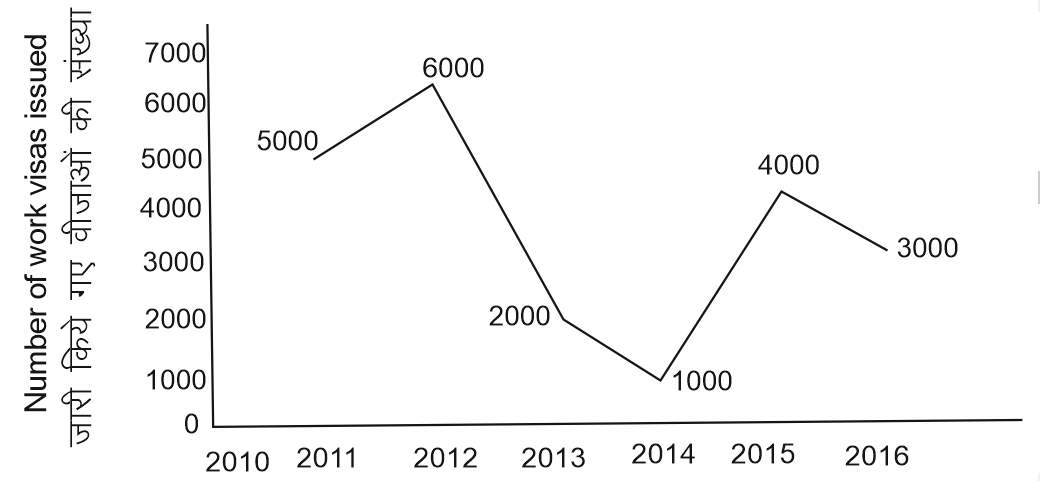
Number of work visas issued were more than those issued in the previous years in how many years ?
1144 05ed9f058e11a1c4b43e6e702
5ed9f058e11a1c4b43e6e702- 11false
- 23false
- 34false
- 42true
- Show AnswerHide Answer
- Workspace
- SingleChoice
Answer : 4. "2 "
Q:Directions: Answer the questions based on the information given below:
The following line graph shows revenue and expenditure of company A for 5 years (in Lakhs):
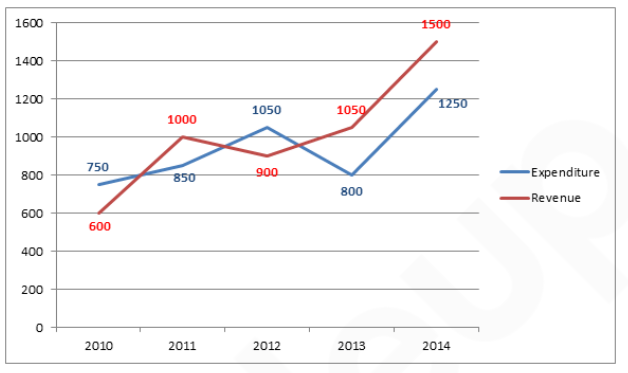
In which year was the profit percentage highest?
Given that: Profit = $$\left({Revenue-Expenditure\over Expenditure } \right)\ $$
1139 060a4e0bef98a5977251a0069
60a4e0bef98a5977251a0069The following line graph shows revenue and expenditure of company A for 5 years (in Lakhs):
Given that: Profit = $$\left({Revenue-Expenditure\over Expenditure } \right)\ $$
- 12014false
- 22010false
- 32011false
- 42012false
- 52013true
- Show AnswerHide Answer
- Workspace
- SingleChoice
Answer : 5. "2013"
Q:Direction : The table given below represents number of bikes of five different brands sold from 2001- 2005, with the help of data given in the table, answer the following questions.
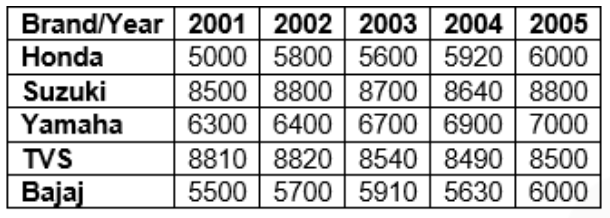
The sales of Yamaha increased from 2001 to 2005 by what percentage?
1134 060a4eed6b33a50608a41f7f0
60a4eed6b33a50608a41f7f0- 113.33%false
- 210.6%false
- 311.11%true
- 412%false
- 5None of thesefalse
- Show AnswerHide Answer
- Workspace
- SingleChoice
Answer : 3. "11.11% "
Q:Study the given graph and answer the question that follows.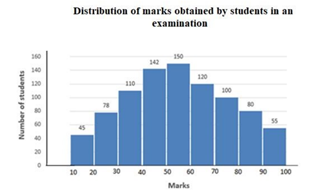
The total number of students obtaining less than 50 marks is what percentage more than the total number of students obtaining 60 marks or more ( correct to one decimal place).
1133 060532740a37d522d6c19c1cd
60532740a37d522d6c19c1cd- 16.8false
- 26.2false
- 34.4false
- 45.6true
- Show AnswerHide Answer
- Workspace
- SingleChoice
Answer : 4. "5.6"
Q:Directions: Read the given pie and table carefully and answer the following questions.
The pie chart shows the percentage distribution of people who found COVID – 19 positive in four major cities of India from 1st July to 31st August 2020 and the table shows the number of people who tested positive in July from these cities.
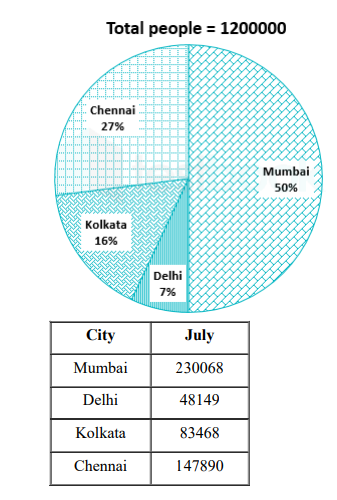
Number of people from Delhi who tested positive in July is what percent of total positive tested people of that city?
1133 064f5664c90902899fbf4708e
64f5664c90902899fbf4708e- 156%false
- 257.32%true
- 362.58%false
- 460%false
- 559.86%false
- Show AnswerHide Answer
- Workspace
- SingleChoice
Answer : 2. "57.32%"
Q:Table below shows the number of candidates appearing for the interview and the percentage of candidates found eligible for the post in various companies (A, B, C, D, E, F).
Study the Tables and give answer the following Questions.
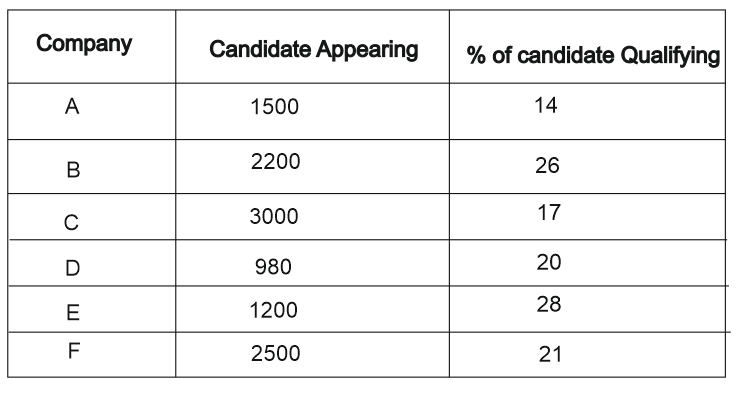
Which company has the lowest number of candidates appearing in the interview?
1130 05f1e750126299776aa40b0bb
5f1e750126299776aa40b0bbStudy the Tables and give answer the following Questions.
- 1Efalse
- 2Dtrue
- 3Cfalse
- 4Afalse
- Show AnswerHide Answer
- Workspace
- SingleChoice
Answer : 2. "D"
Q:The following table shows the number of units of product produced and sold by a company during six years.
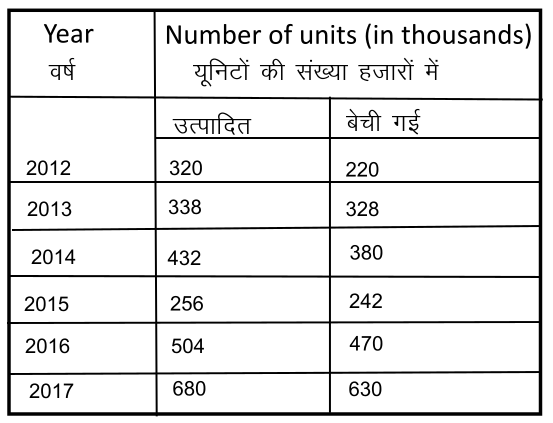
What is the percentage of the number of units produced in 2017 more than the number of units produced since 2012?
1127 05f6d9b315256e8407c2dd4ea
5f6d9b315256e8407c2dd4ea- 1114 %false
- 2112.5 %true
- 3114.25%false
- 4113 %false
- Show AnswerHide Answer
- Workspace
- SingleChoice
Answer : 2. "112.5 %"
Q:Directions: Read the given pie and table carefully and answer the following questions.
The pie chart shows the percentage distribution of people who found COVID – 19 positive in four major cities of India from 1st July to 31st August 2020 and the table shows the number of people who tested positive in July from these cities.
Total peoples tested positive in Delhi is what percent of the total number of people tested positive in Mumbai?
1126 064f567912bbb242750e8a3fd
64f567912bbb242750e8a3fd- 111%false
- 214%true
- 316%false
- 418%false
- 519%false
- Show AnswerHide Answer
- Workspace
- SingleChoice