Data Interpretation Practice Question and Answer
8 Q:Directions: The line graph shows the number of work visas issued by a country in each year from 2011 to 2016. Study the diagram and answer the following questions .
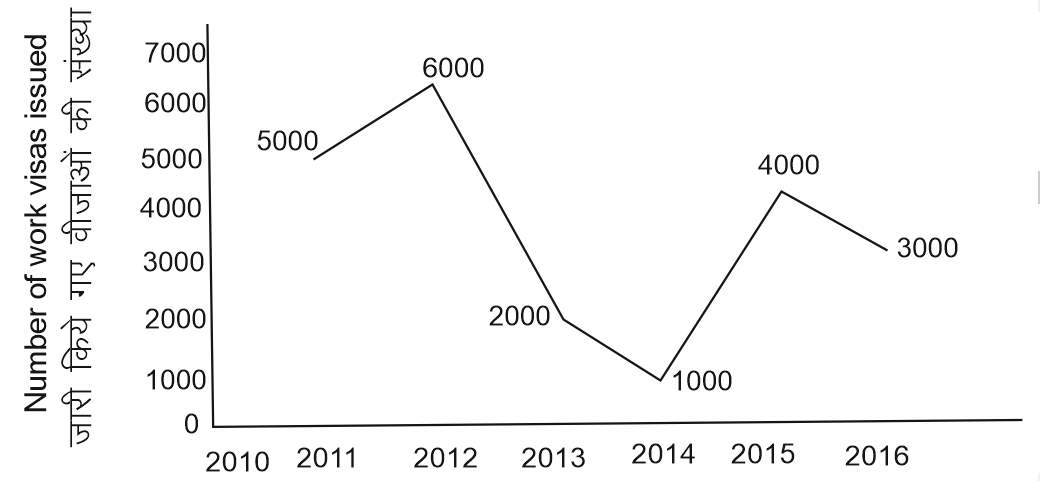
Number of work visas issued in 2016 were lower than the previous year by ?
1209 05ed9f0edf528050f915051e7
5ed9f0edf528050f915051e7- 120 %false
- 2100 %false
- 350 %false
- 425 %true
- Show AnswerHide Answer
- Workspace
- SingleChoice
Answer : 4. "25 %"
Q:Directions: The line graph shows the number of work visas issued by a country in each year from 2011 to 2016. Study the diagram and answer the following questions .
Number of work visas issued were more than those issued in the previous years in how many years ?
1144 05ed9f058e11a1c4b43e6e702
5ed9f058e11a1c4b43e6e702- 11false
- 23false
- 34false
- 42true
- Show AnswerHide Answer
- Workspace
- SingleChoice
Answer : 4. "2 "
Q:Directions: The line graph shows the number of work visas issued by a country in each year from 2011 to 2016. Study the diagram and answer the following questions .
If 10 % of people who are issued work visas do not use the visas , then how many people from 2011 to 2016 have used the visas ?
1249 05ed9efe0f528050f91504f7e
5ed9efe0f528050f91504f7e- 119800false
- 27800false
- 318700false
- 418900true
- Show AnswerHide Answer
- Workspace
- SingleChoice
Answer : 4. "18900"
Q:Directions: The line graph shows the number of work visas issued by a country in each year from 2011 to 2016. Study the diagram and answer the following questions .
What is the total number of visas issued from 2012 to 2015 ?
1190 05ed9ef8be11a1c4b43e6e3b0
5ed9ef8be11a1c4b43e6e3b0- 113000true
- 218000false
- 316000false
- 47000false
- Show AnswerHide Answer
- Workspace
- SingleChoice
Answer : 1. "13000 "
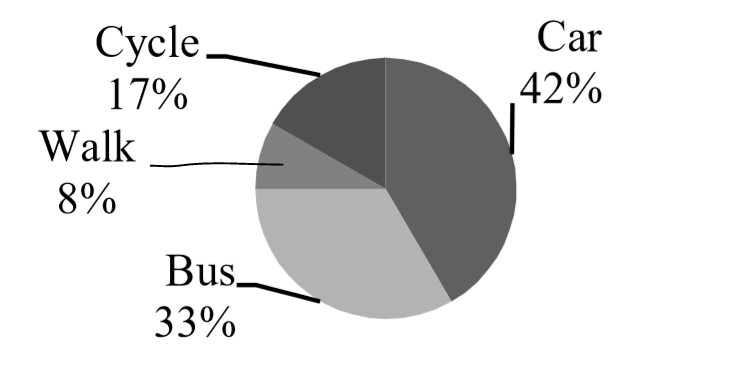
Q: In a school of 1200, students were asked how they travelled to school. The information obtained is depicted by a pie-chart as below. From the given information find how many students come to school by Car?
1888 05ebcc5347fbed1167f1cf2ae
5ebcc5347fbed1167f1cf2ae- 11000false
- 2504true
- 3900false
- 4750false
- Show AnswerHide Answer
- Workspace
- SingleChoice
Answer : 2. "504 "
Q:Comprehension: Read the following chart and answer the following questions.
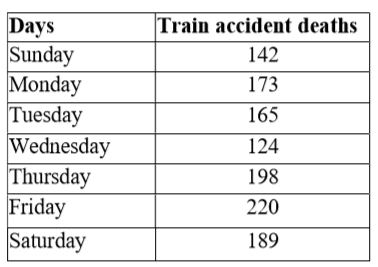
What is the average death rate per day for the week?
1493 05ebcc2da1c43d211834b4136
5ebcc2da1c43d211834b4136- 1173true
- 2172false
- 3183false
- 4163false
- Show AnswerHide Answer
- Workspace
- SingleChoice
Answer : 1. "173 "
Q:Comprehension: Read the following chart and answer the following questions.
What is the difference between the day that had maximum deaths to the day that had minimum deaths?
1355 05ebcc1dcd33dc17bd494cfbe
5ebcc1dcd33dc17bd494cfbe- 1104false
- 286false
- 394false
- 496true
- Show AnswerHide Answer
- Workspace
- SingleChoice
Answer : 4. "96"
Q:Comprehension: Read the following chart and answer the following questions.
Which day of the week recorded maximum train accident deaths?
1487 05ebcc15c1126331540e94b6e
5ebcc15c1126331540e94b6e- 1Sundayfalse
- 2Thursdayfalse
- 3Fridaytrue
- 4Saturdayfalse
- Show AnswerHide Answer
- Workspace
- SingleChoice