Data Interpretation Practice Question and Answer
8 Q:Directions : A bar graph showing the heights of six mountain peaks is given below. Study the bar graph and answer the questions.

When the heights of the given peaks are written in ascending order, what is the average of the middle two peaks?
1078 063930cfa9dda13791d7446ff
63930cfa9dda13791d7446ff- 17950 mfalse
- 27560 mfalse
- 37650 mfalse
- 47850 mtrue
- Show AnswerHide Answer
- Workspace
- SingleChoice
Answer : 4. "7850 m"
Q:Directions: A survery of film watching habits of people living in five cities P, Q, R, S and T is summarised below in a table. The coulmn I in the table gives percentage of film-watchers in each city who see only one film a week. The column II gives the total number of film-watchers who see two or more films per week.
Read the table and answer the following questions.
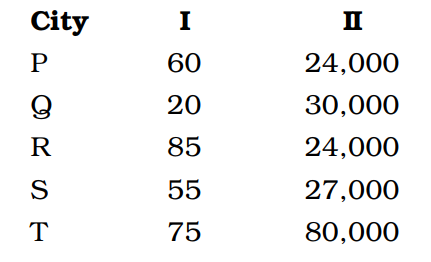
The total number of all film-watchers in the five cities who see only one film in a week is
1074 0632db63e5c208a6bf7f2775c
632db63e5c208a6bf7f2775c- 1113000false
- 2425200false
- 3452500true
- 4500000false
- Show AnswerHide Answer
- Workspace
- SingleChoice
Answer : 3. "452500 "
Q:Directions : The expenses of a country for a particular year is given in Pie–Chart. Read the Pie– Chart and answer the questions.
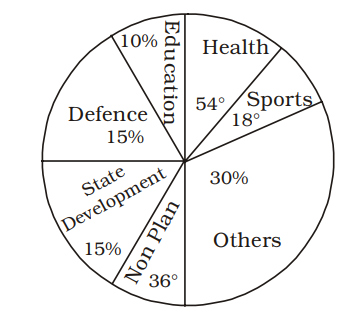
The percent of less money spent on nonplan than that on defense is
1071 063ac34ce612ead74ab54e318
63ac34ce612ead74ab54e318- 115%false
- 25%true
- 312%false
- 410%false
- Show AnswerHide Answer
- Workspace
- SingleChoice
Answer : 2. "5% "
Q: The following bar chart shows the exports (in ₹'0000) of an item from a country 5 consecutive years.
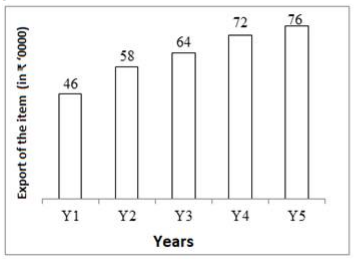
What is the average value of the export of that item from the given country per year?
1071 06422531432185cce370793c0
6422531432185cce370793c0- 1₹5,96,000false
- 2₹6,32,000true
- 3₹6,24,000false
- 4₹6,48,000false
- Show AnswerHide Answer
- Workspace
- SingleChoice
Answer : 2. "₹6,32,000"
Q:The following pie chart gives the central angles of the sectors representing the number of cameras sold form a shop from July to November in a certain Year.
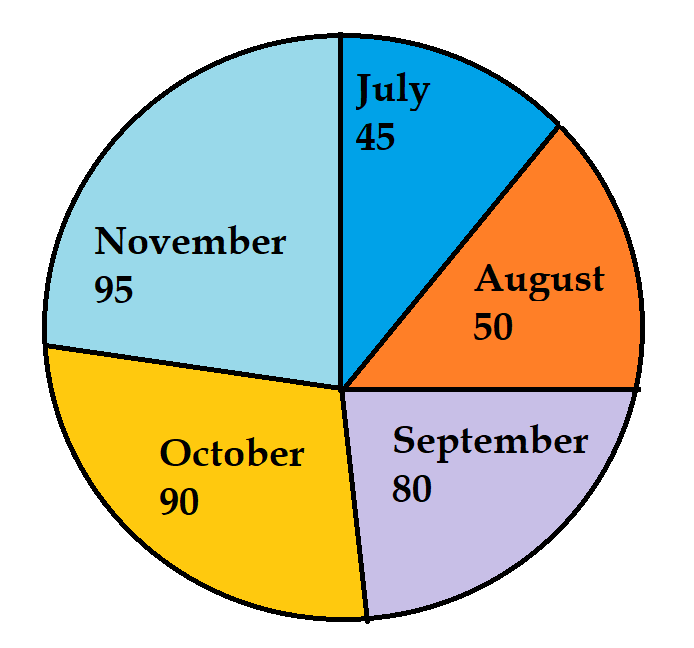
what percentage are the sales in July of the total sales from July to November
1070 06421582f32185cce3704c59f
6421582f32185cce3704c59f- 125%false
- 250%false
- 312.5%true
- 420%false
- Show AnswerHide Answer
- Workspace
- SingleChoice
Answer : 3. "12.5%"
Q:Direction: The following table shows the number of students of 7 colleges A, B, C, D, E, F, G participating in extra-curricular activities :
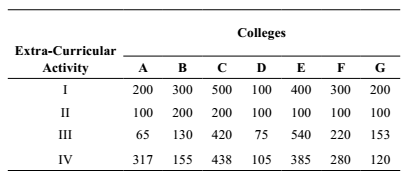
The difference of the number of students in activity IV and the number of students in activity III is –
1069 0601147b12a5c813e1573da6c
601147b12a5c813e1573da6c- 1111false
- 2153true
- 3197false
- 4217false
- Show AnswerHide Answer
- Workspace
- SingleChoice
Answer : 2. "153"
Q:Direction: Read the following graph carefully and answer the following questions:
The following bar graph shows the quantity(in kg) of wheat, rice, pulses and salts sold by two companies P and Q in the month of January.
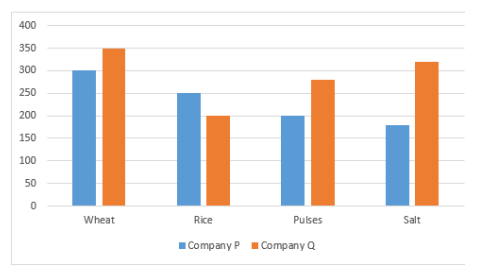
What is the ratio of the total quantity (in kg) of wheat and pulses sold by company P to company Q?
1068 064ddf36690a003851d0552c3
64ddf36690a003851d0552c3The following bar graph shows the quantity(in kg) of wheat, rice, pulses and salts sold by two companies P and Q in the month of January.
- 14:9false
- 24:5true
- 34:3false
- 45:4false
- 54:7false
- Show AnswerHide Answer
- Workspace
- SingleChoice
Answer : 2. "4:5"
Q:Directions: The following Pie Chart shows the export of different food grains from India in 2010. Study the chart and answer the questions:
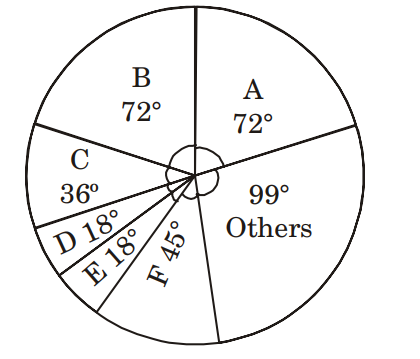
Of the total export of foodgrains, the percentage of crop B exported is
1068 063be693d8f5b1f774c4c4c20
63be693d8f5b1f774c4c4c20- 115%false
- 220%true
- 318%false
- 410%false
- Show AnswerHide Answer
- Workspace
- SingleChoice