Data Interpretation Practice Question and Answer
8 Q:Direction: Study the given pie chart carefully and answer the following questions accordingly. Given pie chart shows the percentage of players taking part in six different games in an event.
Total number of Players = 1800
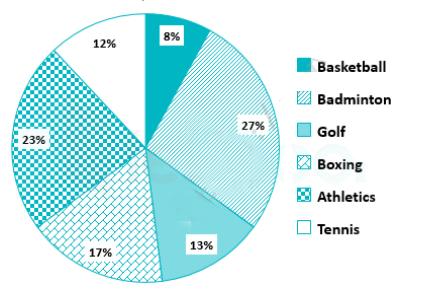
What is the respective ratio of the number of players taking part in Golf and the number of players taking part in Basketball?
1048 064e75e7546497acb22a19437
64e75e7546497acb22a19437- 18 : 13false
- 27 ∶ 13false
- 37 ∶ 26false
- 426 ∶ 7false
- 5None of thesetrue
- Show AnswerHide Answer
- Workspace
- SingleChoice
Answer : 5. "None of these"
Q:Study the graphs to answer these questions.
The pie chart shows the percentage of graduate employees in various department of M/S XYZ limited.
The employees in various departments of M/S. XYZ limited. Other than graduate employees are those employees who are either post graduate or undergraduates.

What is the median of number of graduate employees in Production, Marketing, Planning and Finance departments?
1044 06011442daf82aa3010a2ef35
6011442daf82aa3010a2ef35The pie chart shows the percentage of graduate employees in various department of M/S XYZ limited.
The employees in various departments of M/S. XYZ limited. Other than graduate employees are those employees who are either post graduate or undergraduates.
- 1800false
- 2675true
- 311000false
- 4None of thesefalse
- Show AnswerHide Answer
- Workspace
- SingleChoice
Answer : 2. "675 "
Q:In the following diagram, three different products (in thousands) produced by a company in 5 years are given and after studying them carefully, answer the following questions.
Three products produced by a company in different years (in thousands)
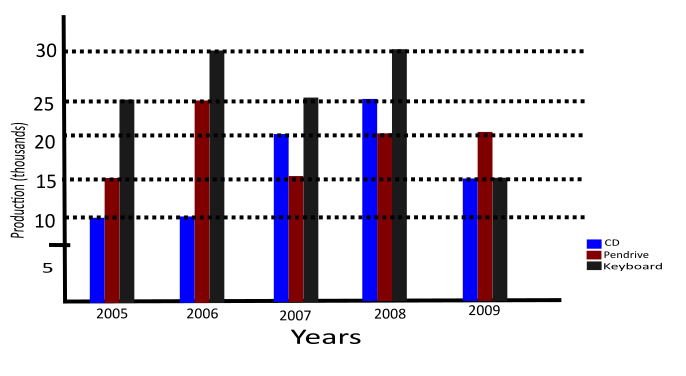
What is the difference between the CD produced between the year 2007 and the year 2009?
1043 05faa5dc15ebf3a64427b0eaa
5faa5dc15ebf3a64427b0eaa- 120,000false
- 215,000true
- 35,000false
- 4500false
- Show AnswerHide Answer
- Workspace
- SingleChoice
Answer : 2. "15,000"
Q:Directions : The pie graph indicates the break-up of the cost of construction of a house. Assuming that the total cost of construction is Rs 6,00,000, answer the following questions.
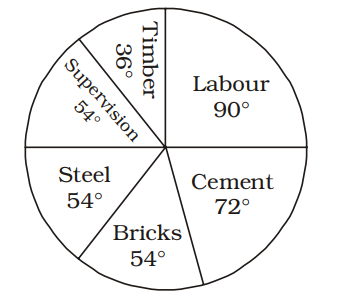
The amount spent on timber is :
1039 063aac275afa10611461ed9ea
63aac275afa10611461ed9ea
- 1₹ 60,000true
- 2₹ 2,00,000false
- 3₹ 30,000false
- 4₹ 50,000false
- Show AnswerHide Answer
- Workspace
- SingleChoice
Answer : 1. "₹ 60,000 "
Q:Directions : The Bar Graph given here shows the population (in crores) of India in various census years. Observe the graph and answer the question based on it.
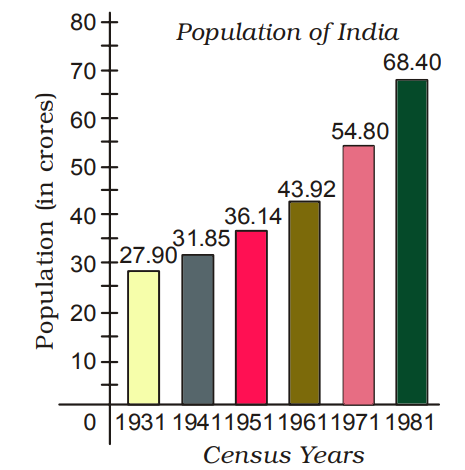
Peryear increase in population from the year 1931 to 1981 is
1039 06453aa5613eb5908ae357970
6453aa5613eb5908ae357970- 18100000true
- 27600000false
- 38900000false
- 46700000false
- Show AnswerHide Answer
- Workspace
- SingleChoice
Answer : 1. "8100000 "
Q:Directions: Study the following table carefully to answer the questions that follow Number of Gold coins (in hundred) produced in Five Different companies during Six Different month.
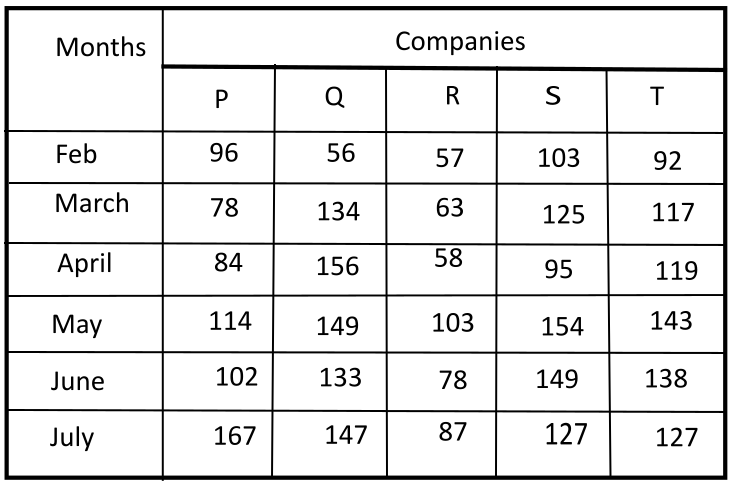
In which company the number of the Gold coins continuously increased during the year February to July?
1037 05fd9c802ee21a5440627e524
5fd9c802ee21a5440627e524- 1Only R and Tfalse
- 2Only Qfalse
- 3Only Pfalse
- 4Only Q and Tfalse
- 5None of thesetrue
- Show AnswerHide Answer
- Workspace
- SingleChoice
Answer : 5. "None of these"
Q: The following pie chart shows the number of bags sold by 7 different shops during a month as percentages of the total number of bags sold during this month by these 7 shops taken together.

If the total number of bags sold during the given month by these 7 shops taken together was 1400, then what was the total number of bags sold by S3 and S 7 taken together?
1034 0642ac3aded76c064b863b95b
642ac3aded76c064b863b95b- 1240false
- 2196false
- 3224true
- 4210false
- Show AnswerHide Answer
- Workspace
- SingleChoice
Answer : 3. "224 "
Q:In the following diagram, three different products (in thousands) produced by a company in 5 years are given and after studying them carefully, answer the following questions.
Three products produced by a company in different years (in thousands)
What will be the average of the Key board produced in the year 2006 and year 2008?
1032 05faa5e20086f7f6870549c78
5faa5e20086f7f6870549c78- 130,000true
- 235,000false
- 360,000false
- 450,000false
- Show AnswerHide Answer
- Workspace
- SingleChoice