Data Interpretation Practice Question and Answer
8 Q: The table below shows the number of overs bowled and the number of wickets taken by five bowlers in a match
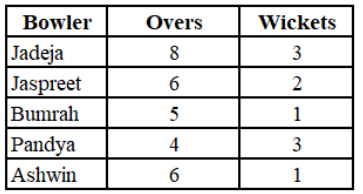
If in each over every bowler bowled 6 balls, in that match which bowler had bowled the highest number of balls per wicket taken by hin1?
1027 0642ac34f08ca2357ae78da0b
642ac34f08ca2357ae78da0b- 1Jadejafalse
- 2Bumrahfalse
- 3Ashwintrue
- 4Jaspreetfalse
- Show AnswerHide Answer
- Workspace
- SingleChoice
Answer : 3. "Ashwin "
Q:Directions : The pie graph indicates the break-up of the cost of construction of a house. Assuming that the total cost of construction is Rs 6,00,000, answer the following questions.
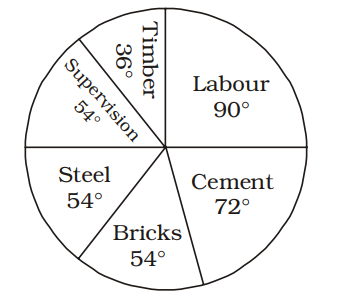
The percentage of the total cost of construction spent on cement, steel and supervision is :
1025 063aac4d45770eb565d513939
63aac4d45770eb565d513939
- 150%true
- 255%false
- 360%false
- 465%false
- Show AnswerHide Answer
- Workspace
- SingleChoice
Answer : 1. "50%"
Q:Directions: Read the pie chart carefully and answer the following questions.
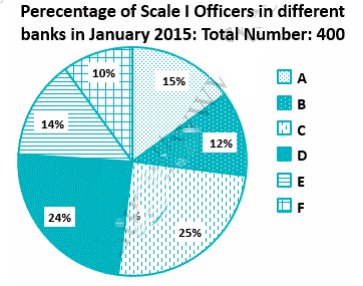
Note: No new employees joined the given banks of left the given banks from January 2015 to December 2015.
In January 2016, some Scale I Officers resigned from Bank C and all of them joined Bank B. If the resultant respective ratio between the number of Scale I Officers in Bank C and that in Bank B is 24 : 13, what is the number of Scale I Officers who resigned from Bank C?
1024 064f1e0103be218b6cde4ef0a
64f1e0103be218b6cde4ef0a- 13false
- 26false
- 37false
- 44true
- 55false
- Show AnswerHide Answer
- Workspace
- SingleChoice
Answer : 4. "4"
Q:Directions : Read the graph and answer the following questions.
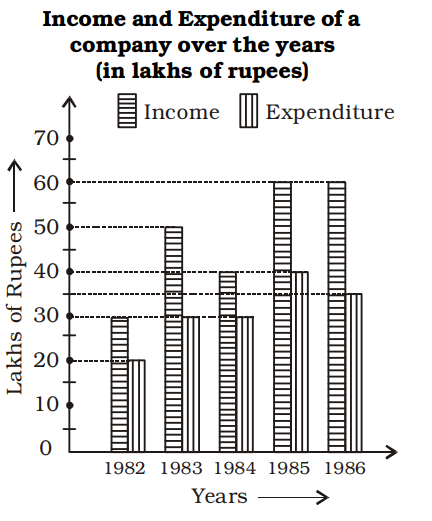
The total income exceeds the total expenditure over the years 1982 to 1986 by
1022 0646104f7c899b466f4459b72
646104f7c899b466f4459b72- 185 lakhstrue
- 2105 lakhsfalse
- 3115 lakhsfalse
- 4120 lakhsfalse
- Show AnswerHide Answer
- Workspace
- SingleChoice
Answer : 1. "85 lakhs "
Q:In the following diagram, three different products (in thousands) produced by a company in 5 years are given and after studying them carefully, answer the following questions.
Three products produced by a company in different years (in thousands)
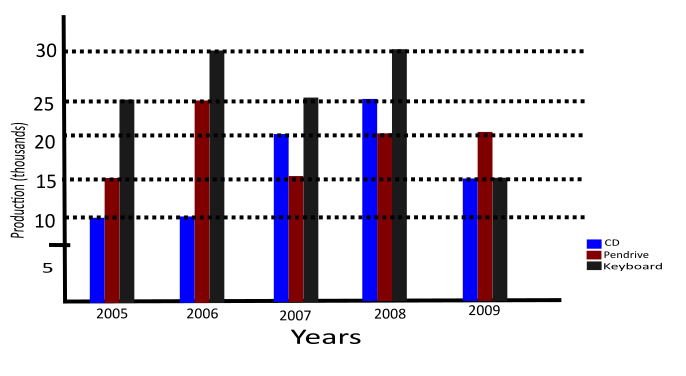
What is the average number of pan-drives produced by the company in all the years?
1013 05faa5d67ece37f513633591b
5faa5d67ece37f513633591b- 132,000false
- 221,000true
- 334,000false
- 410,500false
- Show AnswerHide Answer
- Workspace
- SingleChoice
Answer : 2. "21,000"
Q:Directions: Given bar graph shows the number of plain books and lined books (in hundreds) available at three different stores and the table shows the percentage of total books (Plain + lined) that was sold by different stores.
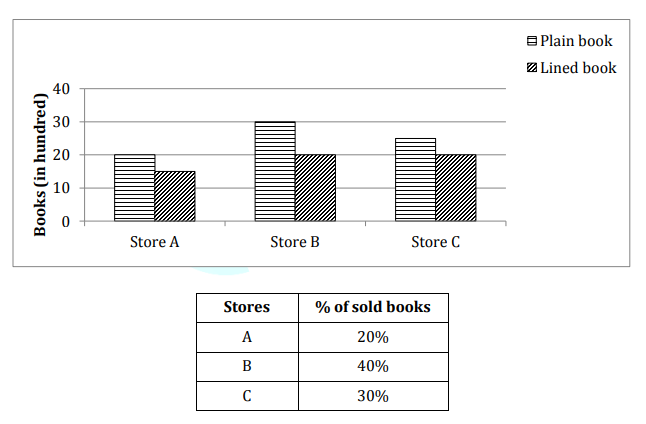
The average of total books sold by stores B and C together is how much more than the total unsold books of store A.
1001 064d5d6cda7983774472605e9
64d5d6cda7983774472605e9- 11125true
- 21075false
- 31055false
- 41175false
- 51225false
- Show AnswerHide Answer
- Workspace
- SingleChoice
Answer : 1. "1125"
Q:Direction: Study the following information to answer the questions.
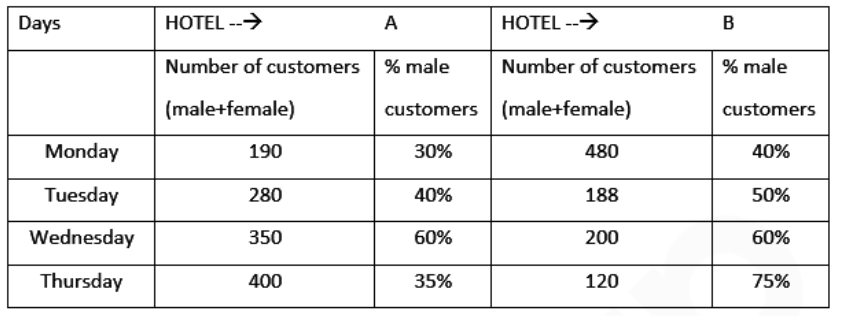
In hotel A, what is the difference between the total number of male customers on Monday and Tuesday together and that on Wednesday and Thursday together?
999 0609d1bc3b9384d208ce0c847
609d1bc3b9384d208ce0c847- 1187false
- 2181true
- 3183false
- 4177false
- 5185false
- Show AnswerHide Answer
- Workspace
- SingleChoice
Answer : 2. "181"
Q:Direction: Read the following graph carefully and answer the following questions:
The following bar graph shows the quantity(in kg) of wheat, rice, pulses and salts sold by two companies P and Q in the month of January.
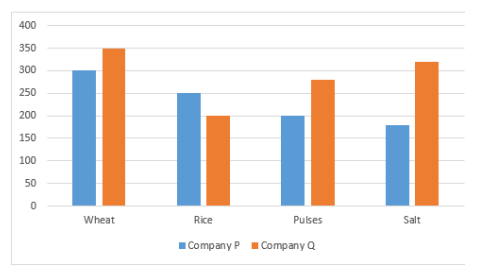
What is the difference between the quantity of Rice and Salts sold by company Q and the quantity of Pulses and Salts sold by company P?
997 064ddf3e12e3b664a0a466750
64ddf3e12e3b664a0a466750The following bar graph shows the quantity(in kg) of wheat, rice, pulses and salts sold by two companies P and Q in the month of January.
- 1140 kgtrue
- 2180 kgfalse
- 3240 kgfalse
- 4210 kgfalse
- 5200 kgfalse
- Show AnswerHide Answer
- Workspace
- SingleChoice