Data Interpretation Practice Question and Answer
8 Q:Directions: Answer the questions based on the information given below:
The following line graph shows revenue and expenditure of company A for 5 years (in Lakhs):
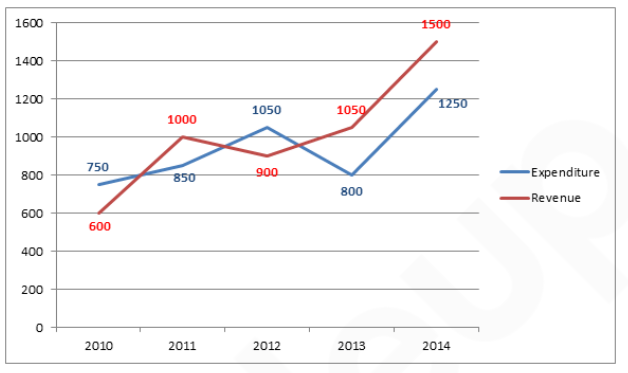
What is the average expenditure of the company A over the years?
995 060a4df38f98a59772519fd74
60a4df38f98a59772519fd74The following line graph shows revenue and expenditure of company A for 5 years (in Lakhs):
- 11000 lakhsfalse
- 21010 lakhsfalse
- 3940 lakhstrue
- 4900 lakhsfalse
- 5None of thesefalse
- Show AnswerHide Answer
- Workspace
- SingleChoice
Answer : 3. "940 lakhs "
Q:Directions: Answer the questions based on the information given below:
The following line graph shows revenue and expenditure of company A for 5 years (in Lakhs):
What is the ratio of sum of expenditure in the year 2012 and 2013 to that of revenue in year 2014?
994 060a4dfcdb1d2440614c00dcb
60a4dfcdb1d2440614c00dcbThe following line graph shows revenue and expenditure of company A for 5 years (in Lakhs):
- 130: 37false
- 237: 30true
- 321: 25false
- 425: 21false
- 5None of thesefalse
- Show AnswerHide Answer
- Workspace
- SingleChoice
Answer : 2. "37: 30 "
Q:Study the graphs to answer these questions.
The pie chart shows the percentage of graduate employees in various department of M/S XYZ limited.
The employees in various departments of M/S. XYZ limited. Other than graduate employees are those employees who are either post graduate or undergraduates.

Number of other than graduate employees in Finance and Planning departments together is what percent greater than number of graduate employees in Administration department? (Approx)
993 06011434caf82aa3010a2ec37
6011434caf82aa3010a2ec37The pie chart shows the percentage of graduate employees in various department of M/S XYZ limited.
The employees in various departments of M/S. XYZ limited. Other than graduate employees are those employees who are either post graduate or undergraduates.
- 1933%true
- 2666%false
- 3533%false
- 4833 %false
- Show AnswerHide Answer
- Workspace
- SingleChoice
Answer : 1. "933% "
Q:Direction: Read the following table carefully and answer the following questions:
Table shows the percentage of male and female employees in different education in a company and total number of males and females:
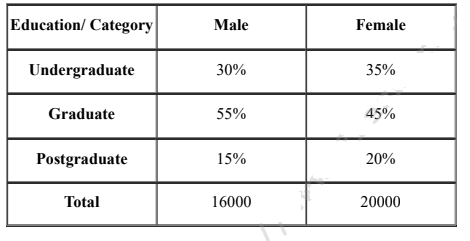
The difference between Graduate female and male employees in the company.
986 064e752a0de1aa1b70fdeed48
64e752a0de1aa1b70fdeed48- 1150false
- 2100false
- 3200true
- 4250false
- 5180false
- Show AnswerHide Answer
- Workspace
- SingleChoice
Answer : 3. "200"
Q: The following table shows the numbers of chairs made of plastic and of steel in 5 different colours that were sold from a furniture showroom during a sale.
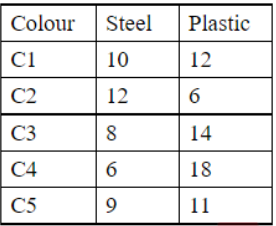
The total number of chairs of colour C3 sold are what percentage of all the chairs of these 5 colours sold, both plastic and steel ones put together? [Give your answer correct to 2 decimal places.]
980 06433ce607ac9a186e4f72182
6433ce607ac9a186e4f72182- 117.75%false
- 220.75%true
- 314.75%false
- 423.75%false
- Show AnswerHide Answer
- Workspace
- SingleChoice
Answer : 2. "20.75%"
Q:Table below shows the number of candidates appearing for the interview and the percentage of candidates found eligible for the post in various companies (A, B, C, D, E, F).
Study the Tables and give answer the following Questions.
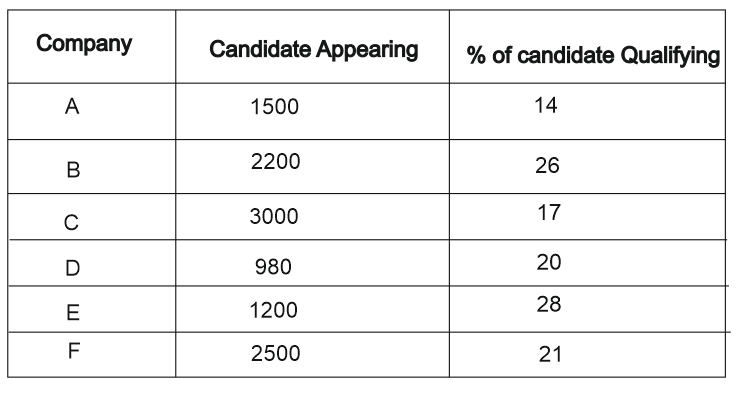
What is the difference between the qualified candidates of Company A and Company D?
978 05f1e749d3b87486bfc539758
5f1e749d3b87486bfc539758Study the Tables and give answer the following Questions.
- 116false
- 214true
- 318false
- 412false
- Show AnswerHide Answer
- Workspace
- SingleChoice
Answer : 2. "14"
Q:Direction: Read the following table carefully and answer the following questions:
Table shows the percentage of male and female employees in different education in a company and total number of males and females:
Find the number of Undergraduate male employees is approximately what percent less than the number of undergraduate female employees?
978 064e7524cd928d8b716136a79
64e7524cd928d8b716136a79- 131%true
- 221%false
- 327%false
- 424%false
- 534%false
- Show AnswerHide Answer
- Workspace
- SingleChoice
Answer : 1. "31%"
Q: Given is a line graph showing the number of accidents in a city during the first 6 months of 1999.

The decrease % of accidents from May to June is
976 063ee1dc6b0030e718d806138
63ee1dc6b0030e718d806138- 1$$15{3\over8}\% $$false
- 2$$15{1\over8}\% $$false
- 3$$15{5\over8}\% $$true
- 4$$15{7\over8}\% $$false
- Show AnswerHide Answer
- Workspace
- SingleChoice