Data Interpretation Practice Question and Answer
8 Q:Directions : Study the following graph and answer the questions.
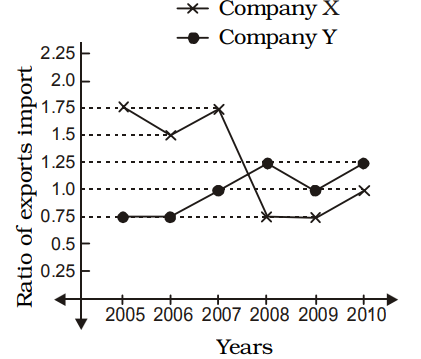
In 2005, the exports of company X were double that of company Y in that year. If the imports of company X during the year were 180 crores, what was the amount (in crore) of imports of company Y during the year?
920 063a5564424e8fb08b9fd64c7
63a5564424e8fb08b9fd64c7 - 1212false
- 2210true
- 3315false
- 4282false
- Show AnswerHide Answer
- Workspace
- SingleChoice
Answer : 2. "210 "
Q:Direction: Read the following table carefully and answer the following questions:
Table shows the percentage of male and female employees in different education in a company and total number of males and females:
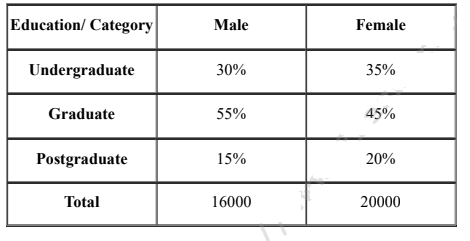
Find the ratio between the number of female and male employees of postgraduate.
918 064e751fe3be218b6cdc7ecd6
64e751fe3be218b6cdc7ecd6- 11 : 1false
- 22 : 3false
- 33 : 2false
- 45 : 3true
- 54 : 3false
- Show AnswerHide Answer
- Workspace
- SingleChoice
Answer : 4. "5 : 3"
Q:Directions: A survery of film watching habits of people living in five cities P, Q, R, S and T is summarised below in a table. The coulmn I in the table gives percentage of film-watchers in each city who see only one film a week. The column II gives the total number of film-watchers who see two or more films per week.
Read the table and answer the following questions.
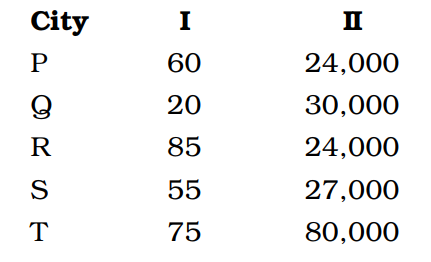
How many film-watchers in city R see only one film in a week ?
914 0632db529751e5310a5d0ffa1
632db529751e5310a5d0ffa1- 124850false
- 236000false
- 3136000true
- 4160000false
- Show AnswerHide Answer
- Workspace
- SingleChoice
Answer : 3. "136000 "
Q:Directions: Following is the pie-chart showing the spending of a family on various items in a particular year
Study the pie chart and answer questions
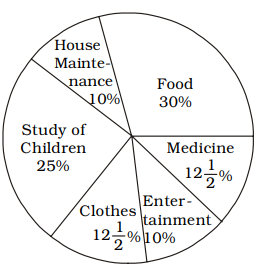
Angle of the pie chart representing the expenditure on entertainment is
913 063be702174eba5069d517362
63be702174eba5069d517362- 115°false
- 210°false
- 336°true
- 426°false
- Show AnswerHide Answer
- Workspace
- SingleChoice
Answer : 3. "36°"
Q:Directions : The pie graph indicates the break-up of the cost of construction of a house. Assuming that the total cost of construction is Rs 6,00,000, answer the following questions.
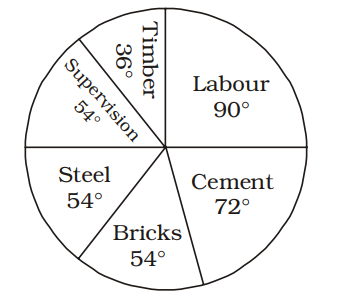
The amount spent on labor exceeds the amount spent on supervision by :
912 063aac38ae541fa7a0123208a
63aac38ae541fa7a0123208a
- 1₹ 1,00,000false
- 2₹ 1,20,000false
- 3₹ 60,000true
- 4₹ 30,000false
- Show AnswerHide Answer
- Workspace
- SingleChoice
Answer : 3. "₹ 60,000 "
Q:Directions: Following is the pie-chart showing the spending of a family on various items in a particular year
Study the pie chart and answer questions
The ratio of the total amount spent for food and medicine is
912 063be6ef28f5b1f774c4c911f
63be6ef28f5b1f774c4c911f- 11 : 2false
- 23 : 1false
- 312 : 5true
- 411 : 5false
- Show AnswerHide Answer
- Workspace
- SingleChoice
Answer : 3. "12 : 5 "
Q:Directions : In an Institution there are 800 students. Students use different modes of transport for going to the institution and return. The given pie diagram represents the requisite data. Study the diagram carefully and answer the questions.

The number of students who go to institute on foot is
909 063ac336e612ead74ab54dc90
63ac336e612ead74ab54dc90- 1160true
- 2170false
- 3120false
- 4106false
- Show AnswerHide Answer
- Workspace
- SingleChoice
Answer : 1. "160 "
Q: The table below gives the ranks secured by five different students in three different subjects in a qualifying examination:
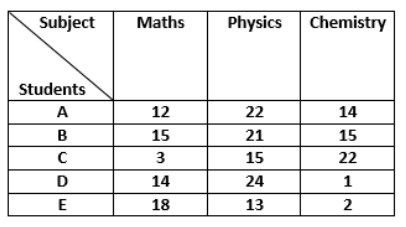
Find the positive difference between the ranks secured by A in Physics and in Maths.
909 06426e16c32185cce37134f5f
6426e16c32185cce37134f5f- 125false
- 210true
- 315false
- 420false
- Show AnswerHide Answer
- Workspace
- SingleChoice