Data Interpretation Practice Question and Answer
8 Q:Study the following pie-diagrams carefully and answer the question given below it.
PERCENTAGE COMPOSITION OF HUMAN BODY
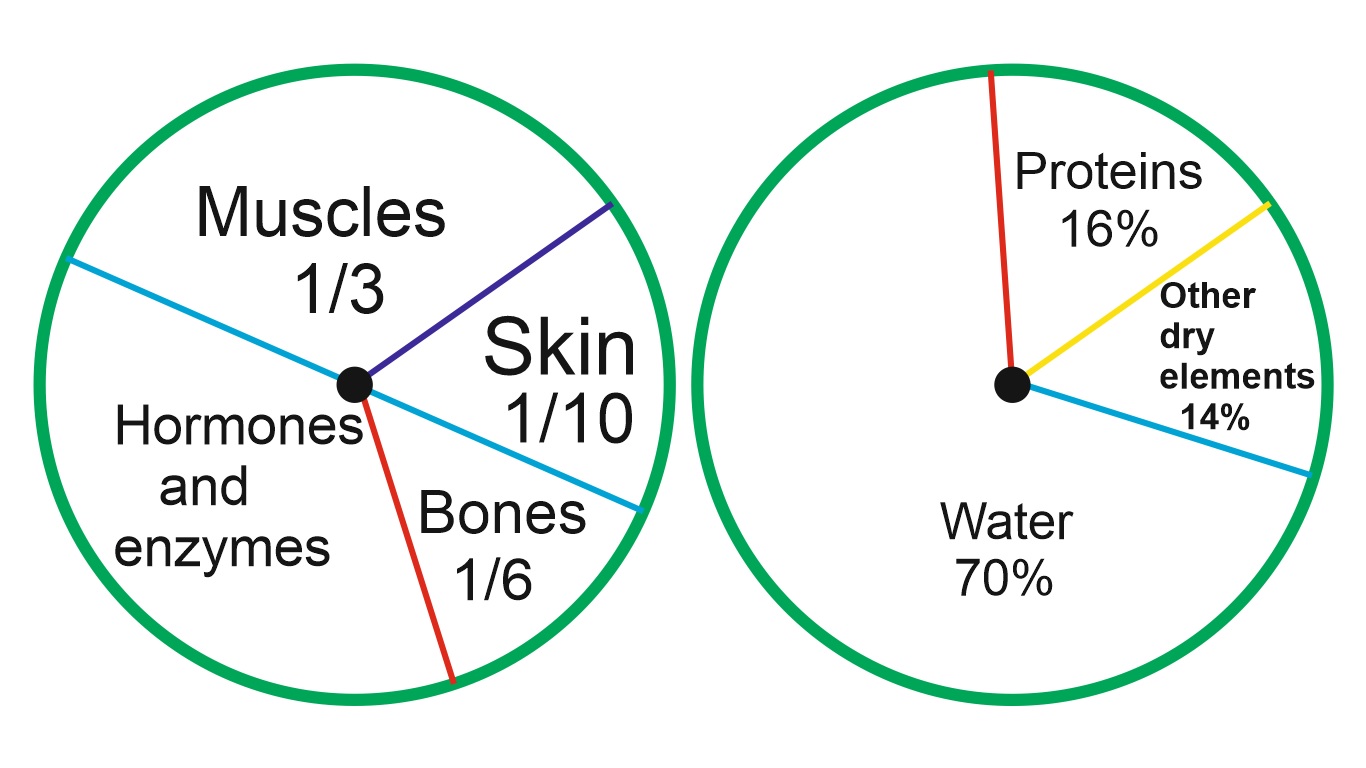
what will be the quantity of water in the body of a person weighing 50 kg?
2815 05dcc0725e9d33d6509bf4869
5dcc0725e9d33d6509bf4869PERCENTAGE COMPOSITION OF HUMAN BODY
- 120 kgfalse
- 235 kgtrue
- 341 kgfalse
- 442.5 kgfalse
- Show AnswerHide Answer
- Workspace
- SingleChoice
Answer : 2. "35 kg"
Q:The following line graph gives the percentage of the number of candidates who qualified an examination out of the total number of candidates who appeared for the examination over a period of seven years from 1994 to 2000.
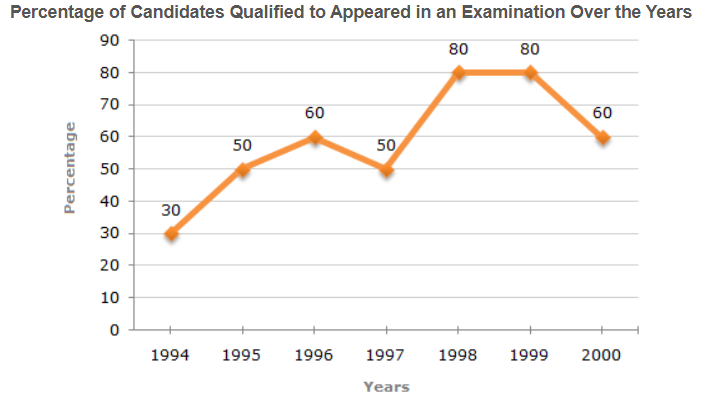
If the total number of candidates appeared in 1996 and 1997 together was 47400, then the total number of candidates qualified in these two years together was?
2734 05e799c4350339c736663124c
5e799c4350339c736663124c- 134700false
- 232100false
- 331500false
- 4Data inadequatetrue
- 5None of thesefalse
- Show AnswerHide Answer
- Workspace
- SingleChoice
Answer : 4. "Data inadequate"
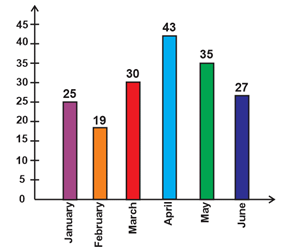
Q: By what number, is the number of accidents that occurred in April is greater than the average number of Accidents that occurred during the 6 months period?
2711 05d775ff413ddea5af63440a7
5d775ff413ddea5af63440a7- 113.17true
- 28false
- 39false
- 411false
- Show AnswerHide Answer
- Workspace
- SingleChoice
Answer : 1. "13.17"
Q:Direction (94-98): Study the following table to answer the given questions.
Centre and Post-wise Numbered of candidate
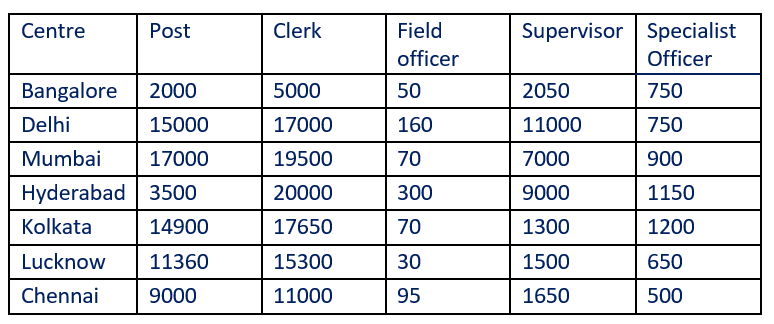
In Kolkata, number of Specialist Officers is approximately what percent of that of Officers?
2686 05da4033ffac0ed7fa90c3844
5da4033ffac0ed7fa90c3844Centre and Post-wise Numbered of candidate
- 18.7false
- 29false
- 36.5false
- 48true
- 56.9false
- Show AnswerHide Answer
- Workspace
- SingleChoice
Answer : 4. "8"
Q:The following line graph gives the percentage of the number of candidates who qualified an examination out of the total number of candidates who appeared for the examination over a period of seven years from 1994 to 2000.
The total number of candidates qualified in 1999 and 2000 together was 33500 and the number of candidates appeared in 1999 was 26500. What was the number of candidates in 2000?
2652 05e799cbc8560ba13b02739f0
5e799cbc8560ba13b02739f0- 124500false
- 222000false
- 320500true
- 419000false
- 5None of thesefalse
- Show AnswerHide Answer
- Workspace
- SingleChoice
Answer : 3. "20500"
Q:Directions: The following pie-chart represents the result of 600 successful students in various subject of an examination. Study the Pie-chart and answer question.
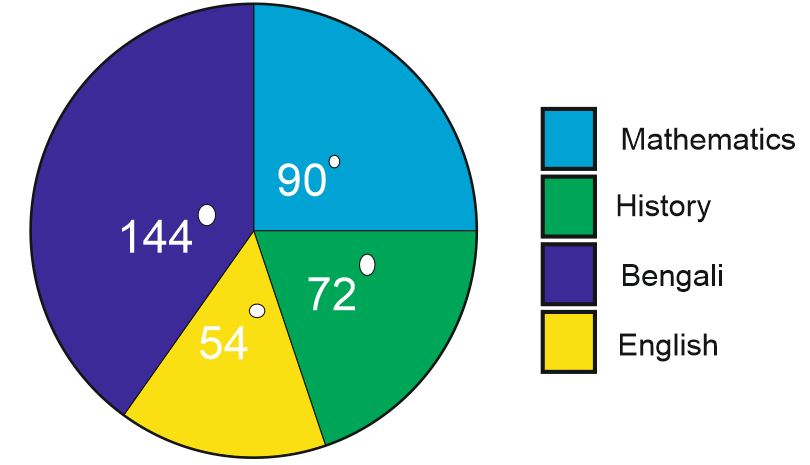
The percentage of students who passed in English is
2642 05ee3016e2bf4c40446491e93
5ee3016e2bf4c40446491e93- 115%true
- 220%false
- 35%false
- 412%false
- Show AnswerHide Answer
- Workspace
- SingleChoice
Answer : 1. "15%"
Q:Directions:Study the following table carefully to answer these questions:
Percentage of Marks obtained by six students in six subjects

Marks obtained by C in Maths are approximately what per cent of his total marks obtained in all the six subjects together ?
2632 05e78a3f150339c736661515d
5e78a3f150339c736661515d- 122false
- 216false
- 320false
- 418false
- 528true
- Show AnswerHide Answer
- Workspace
- SingleChoice
Answer : 5. "28 "
Q:Directions: The bar graph, given here, shows the number of tickets sold by 6 students A, B, C, D, E and F during a fair.
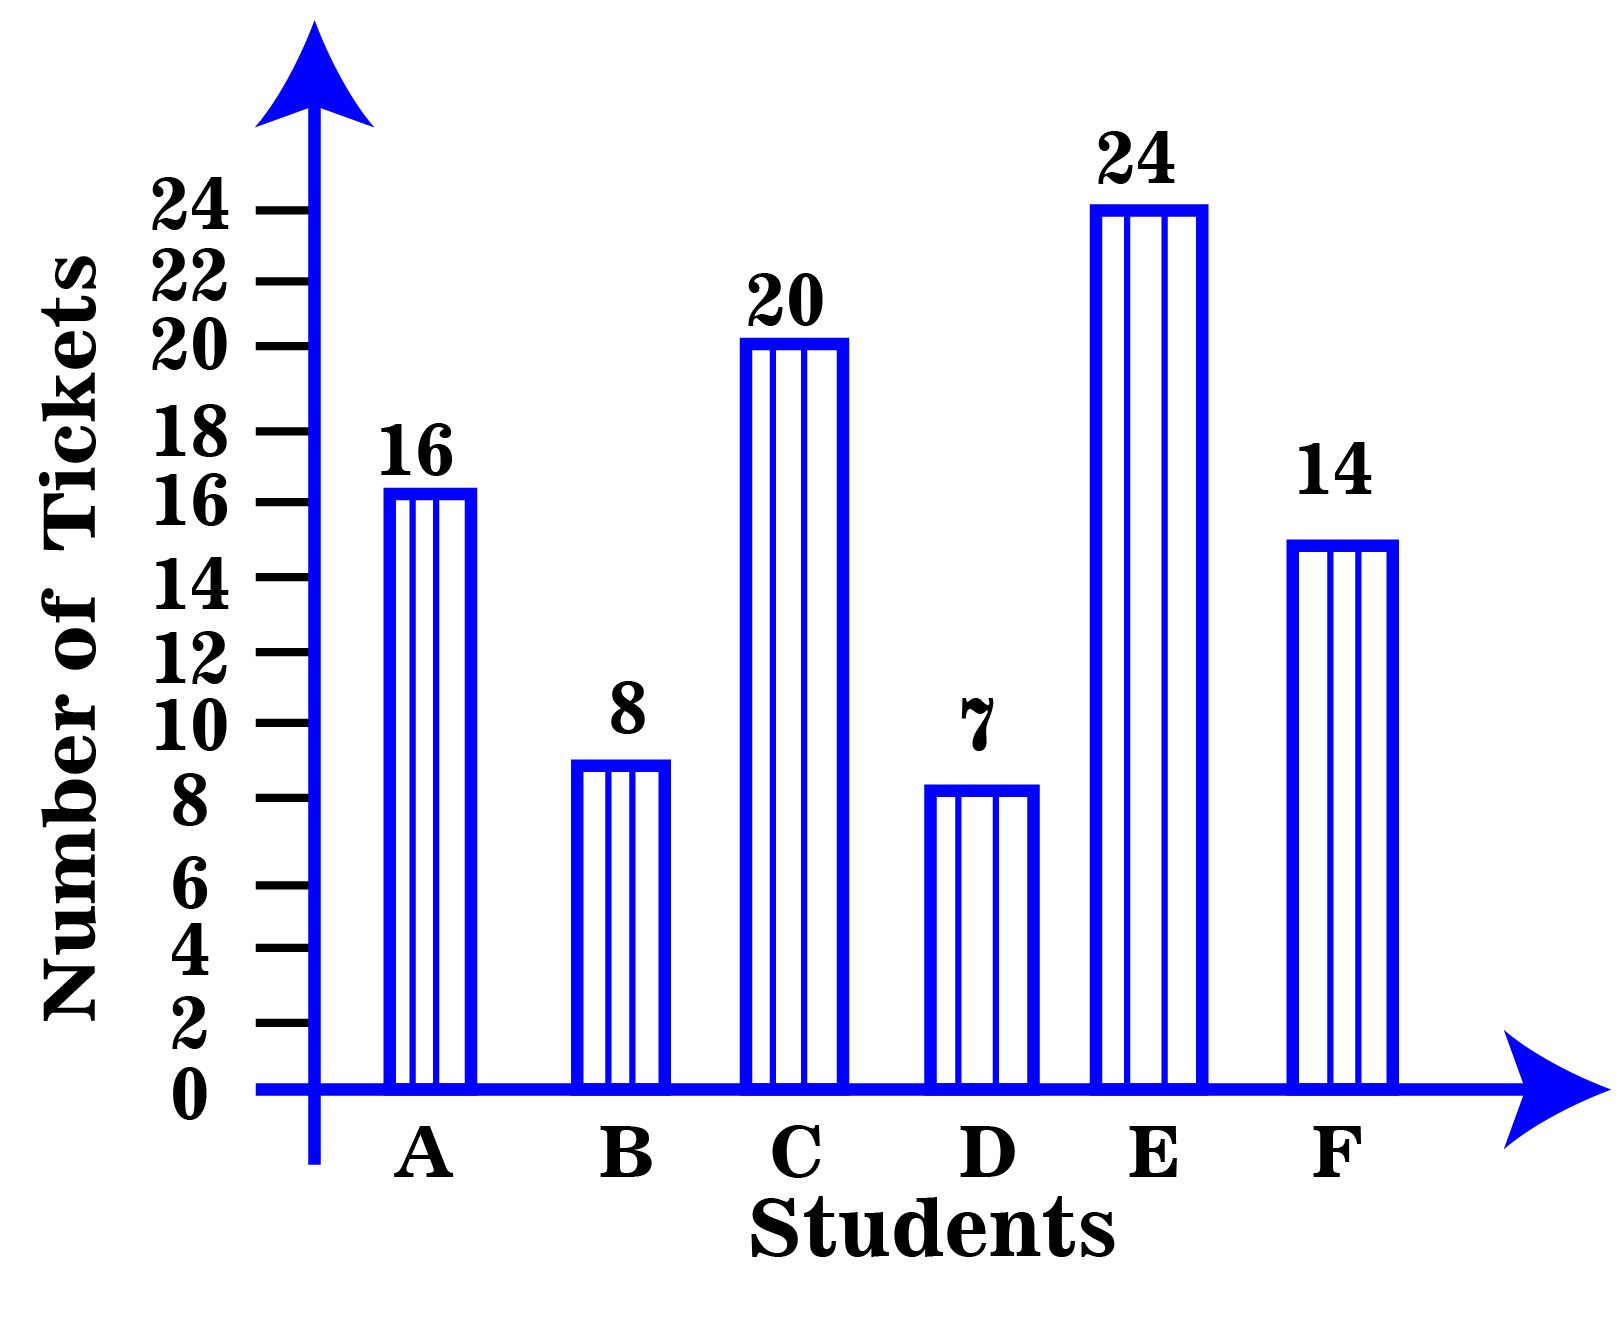
Total number of tickets sold by A, B and C is
2596 05ea81363a63dac4c26cbd00d
5ea81363a63dac4c26cbd00d- 145false
- 244true
- 342false
- 440false
- 5None of thesefalse
- Show AnswerHide Answer
- Workspace
- SingleChoice