Data Interpretation Practice Question and Answer
8 Q:Directions: The bar graph given below shows the spending of family income on various items and savings during 1993. Observe the graph and answer the following questions:
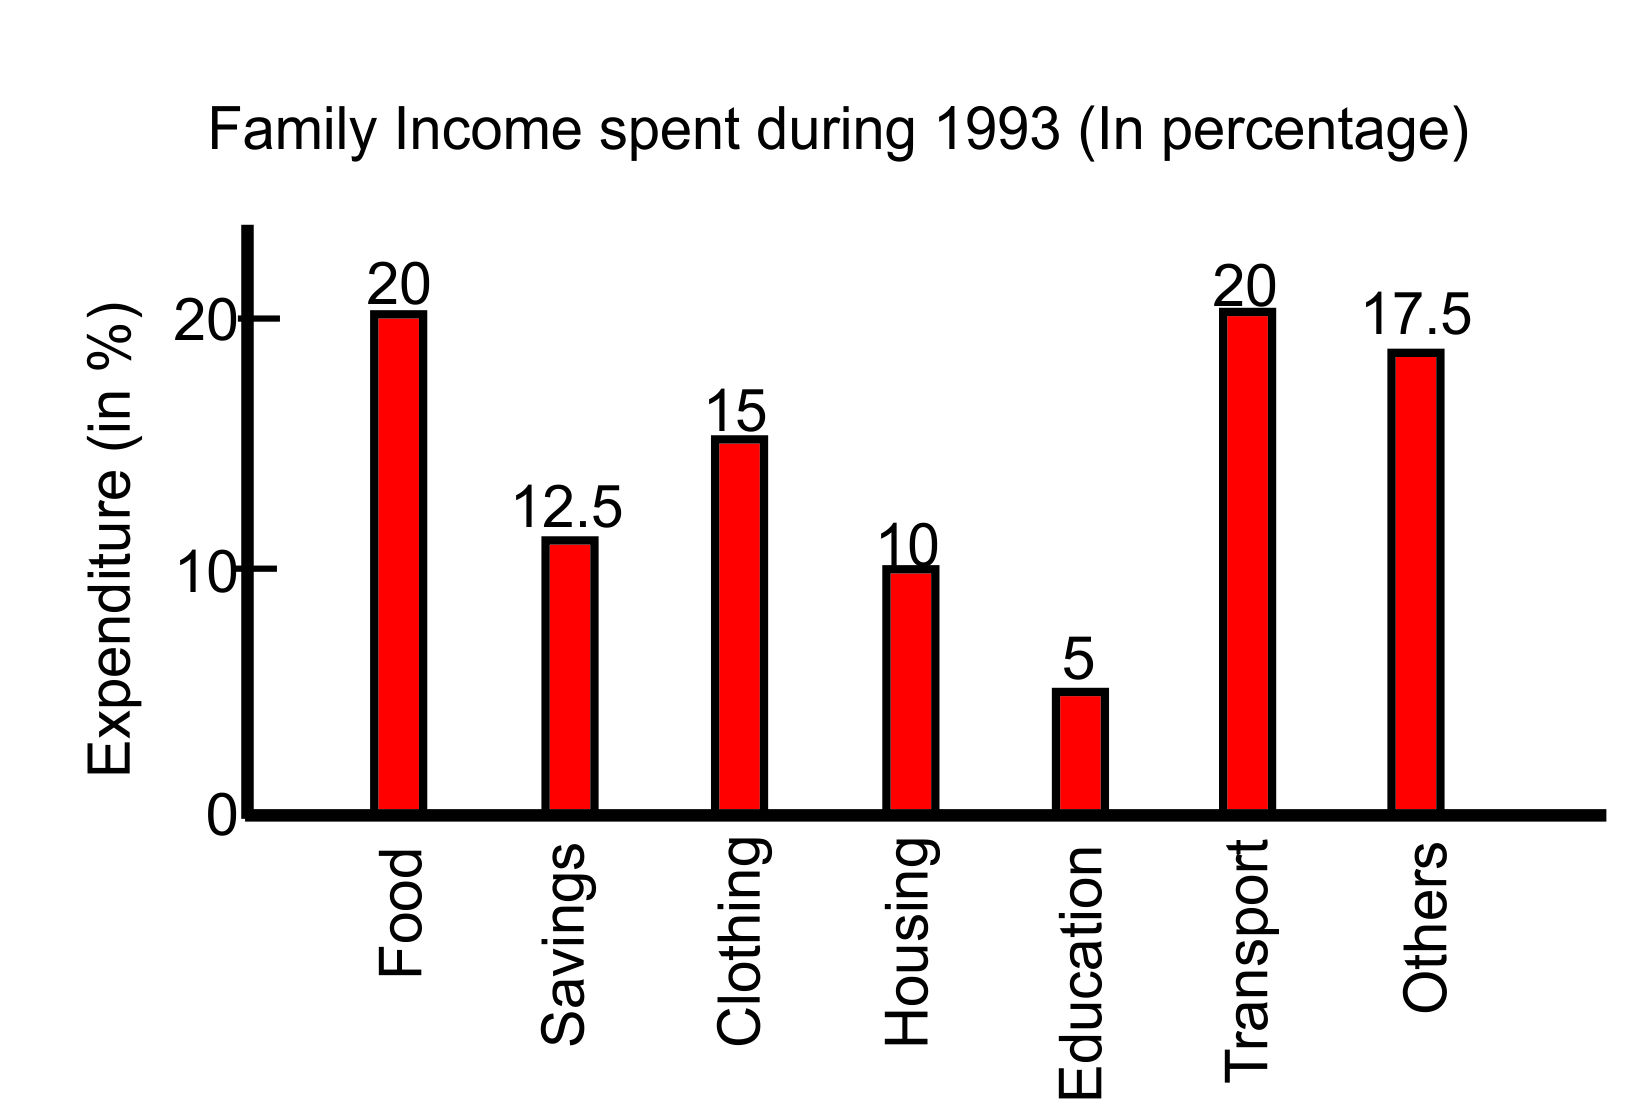
The percent of income spent on food is:
1479 05def3b1b5b0f1b05dcfc4452
5def3b1b5b0f1b05dcfc4452- 15 %false
- 210 %false
- 312.5 %false
- 420 %true
- Show AnswerHide Answer
- Workspace
- SingleChoice
Answer : 4. "20 % "
Q:The following pie-chart shows the monthly expenditure of family on various items. If the family spends Rs. 825 on clothing answer the question
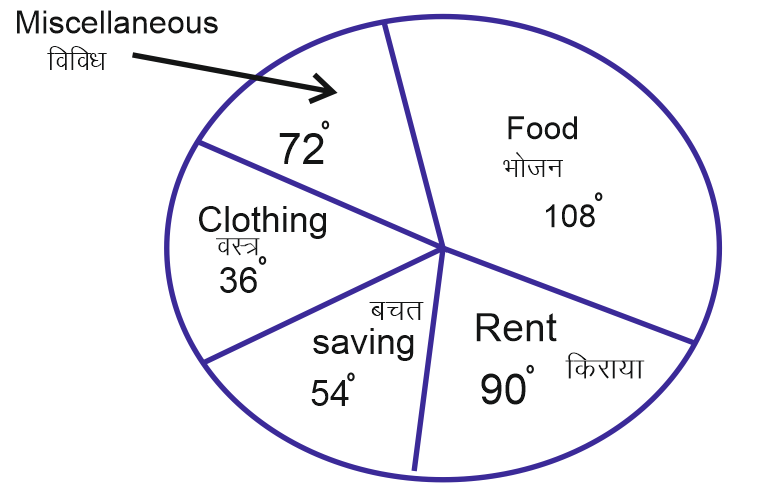
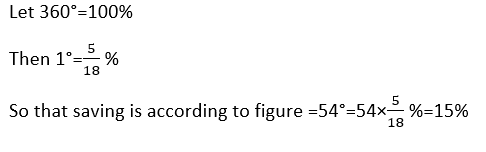
What percent of the total income does the family save
1605 05de4e15d76066724df64c321
5de4e15d76066724df64c321- 115 %true
- 250%false
- 320%false
- 425%false
- Show AnswerHide Answer
- Workspace
- SingleChoice
Answer : 1. "15 %"
Explanation :
Q:The following pie-chart shows the monthly expenditure of family on various items. If the family spends Rs. 825 on clothing answer the question
What is the total monthly income of the family?
1650 05de4e10f76066724df64c2c8
5de4e10f76066724df64c2c8- 1Rs. 8025false
- 2Rs. 8520false
- 3Rs. 8250true
- 4Rs. 8052/false
- Show AnswerHide Answer
- Workspace
- SingleChoice
Answer : 3. "Rs. 8250"
Q:The following pie-chart shows the monthly expenditure of family on various items. If the family spends Rs. 825 on clothing answer the question
The ratio of average of expenses on food, clothing and miscellaneous items to the average of expenses of on saving and rent is
1604 05de4e1fa57778c24100555a9
5de4e1fa57778c24100555a9- 13:2false
- 22:1false
- 31:3false
- 41:1true
- Show AnswerHide Answer
- Workspace
- SingleChoice
Answer : 4. "1:1"
Q:The following pie-chart shows the monthly expenditure of family on various items. If the family spends Rs. 825 on clothing answer the question
What is the ratio of expenses on food and miscellaneous ?
1450 05de4e19d57778c24100554d6
5de4e19d57778c24100554d6- 13:4false
- 23:2true
- 32:3false
- 42:5false
- Show AnswerHide Answer
- Workspace
- SingleChoice
Answer : 2. "3:2"
Q:Directions: The bar chart given below shows the percentage distribution of the production of various models of a mobile manufacturing company in 2007 and 2008. The total production in 2007 was 35 lakh mobile phones and in 2008 the production was 44 lakh. Study the chart and answer the following questions.
Percentage of six different types of mobiles manufactured by a company over two year
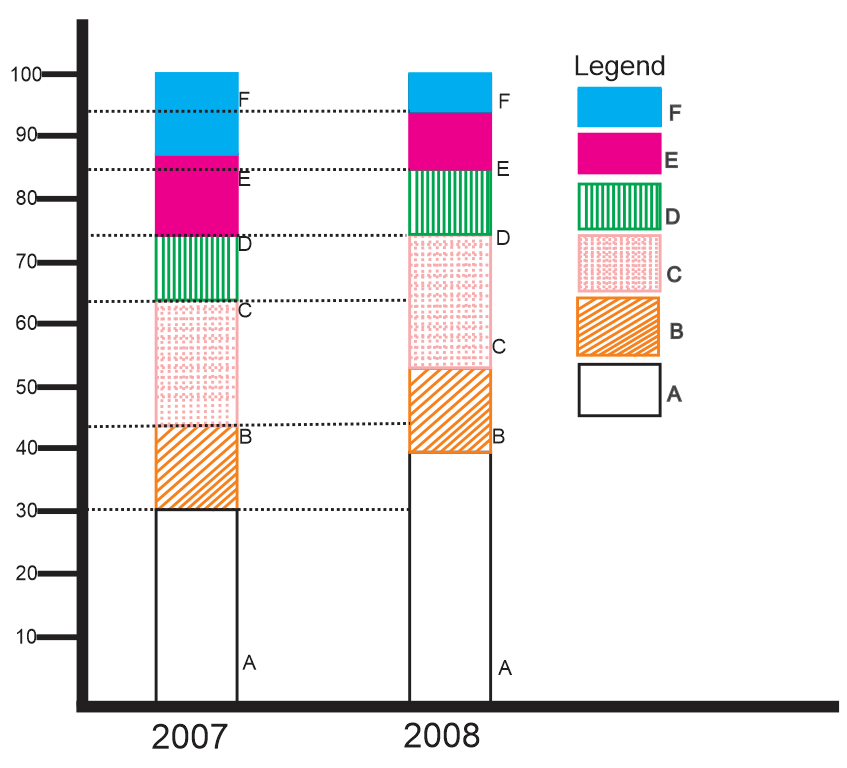
If 85% of the D type mobile produce in each year were sold by the company, how many D type mobiles remained unsold?
1461 05dd685d7c2282c484e4cab56
5dd685d7c2282c484e4cab56Percentage of six different types of mobiles manufactured by a company over two year
- 176,500false
- 293,500false
- 31,18,500true
- 41,22,500false
- Show AnswerHide Answer
- Workspace
- SingleChoice
Answer : 3. "1,18,500"
Q:Directions: The bar chart given below shows the percentage distribution of the production of various models of a mobile manufacturing company in 2007 and 2008. The total production in 2007 was 35 lakh mobile phones and in 2008 the production was 44 lakh. Study the chart and answer the following questions.
Percentage of six different types of mobiles manufactured by a company over two year
If the percentage production of A type mobiles in 2008 as same as that in 2007, then the number of A type mobiles produced in 2008 would have been
1371 05dd6849ac2282c484e4ca5c6
5dd6849ac2282c484e4ca5c6Percentage of six different types of mobiles manufactured by a company over two year
- 114,00,000false
- 213,20,000true
- 311,70,000false
- 410,50,000false
- Show AnswerHide Answer
- Workspace
- SingleChoice
Answer : 2. "13,20,000 "
Q:Directions: The bar chart given below shows the percentage distribution of the production of various models of a mobile manufacturing company in 2007 and 2008. The total production in 2007 was 35 lakh mobile phones and in 2008 the production was 44 lakh. Study the chart and answer the following questions.
Percentage of six different types of mobiles manufactured by a company over two year
What was the difference in the number of B type mobiles produced in 2007 and 2008?
1307 05dd68408db51363c023a73a0
5dd68408db51363c023a73a0Percentage of six different types of mobiles manufactured by a company over two year
- 13,55,000true
- 22,70,000false
- 32,25,000false
- 41,75,000false
- Show AnswerHide Answer
- Workspace
- SingleChoice