


Data Interpretation Practice Question and Answer
8 Q:Directions: Study the following information carefully and answer the questions given below.
In the table, the percentage of shirts (formal and casual) sold out of the total number of shirts sold in the week and the number of casual shirts sold data related to the number of shirts sold on ve weekdays – Monday, Tuesday, Wednesday, Thursday and Friday are given.
Total number of shirts sold in the week = x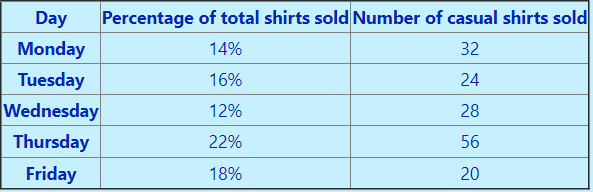 Note: Total number of shirts sold on Saturday and Sunday together = 72
40% of casual shirts sold and 25% of formal shirts sold on Friday of brand X, then the number of shirts sold of brands other than X on Friday is
1085 064e5ef003be218b6cdc29ab1
64e5ef003be218b6cdc29ab1In the table, the percentage of shirts (formal and casual) sold out of the total number of shirts sold in the week and the number of casual shirts sold data related to the number of shirts sold on ve weekdays – Monday, Tuesday, Wednesday, Thursday and Friday are given.
Note: Total number of shirts sold on Saturday and Sunday together = 72- 121false
- 231false
- 341false
- 451true
- 5None of thesefalse
- Show AnswerHide Answer
- Workspace
- SingleChoice
Answer : 4. "51"
Q:Directions: Read the below data carefully and answer the following questions.
The table shows the total number of ice cream (Chocobar + Cornetto) was given by Santa Claus on the day of Xmas to 5 children. It also shows the number of Chocobar ice-creams is how much more or less percentage of the total number of Cornetto ice-creams.
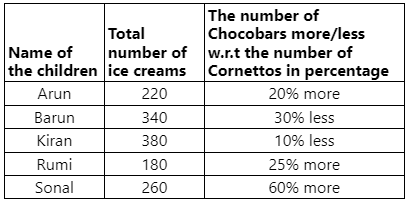
What is the average number of Chocobar ice creams they all have?
1082 064dcca7380ef1e74b4edcbda
64dcca7380ef1e74b4edcbdaThe table shows the total number of ice cream (Chocobar + Cornetto) was given by Santa Claus on the day of Xmas to 5 children. It also shows the number of Chocobar ice-creams is how much more or less percentage of the total number of Cornetto ice-creams.
- 1140true
- 2240false
- 3320false
- 4150false
- 5560false
- Show AnswerHide Answer
- Workspace
- SingleChoice
Answer : 1. "140"
Q:Directions : Study the following pie chart carefully and answer the questions. The pie chart represents the percentage of people involved in various occupations.
Total number of people = 20000
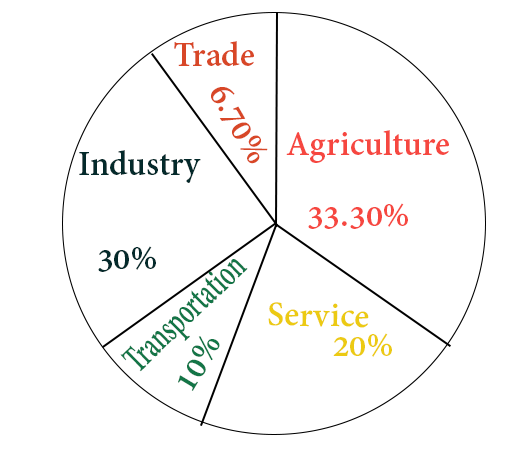
The difference between the maximum number of people involved and minimum number of people involved in various professions is
1081 06453a55339143d085f3e5a73
6453a55339143d085f3e5a73Total number of people = 20000
- 12640false
- 23640false
- 36320false
- 45320true
- Show AnswerHide Answer
- Workspace
- SingleChoice
Answer : 4. "5320"
Q:Directions : The following graph shows production (in thousands) of two types (P and Q) of vehicles by a factory over the years 2009 to 2014. Study the graph and answer the given questions.
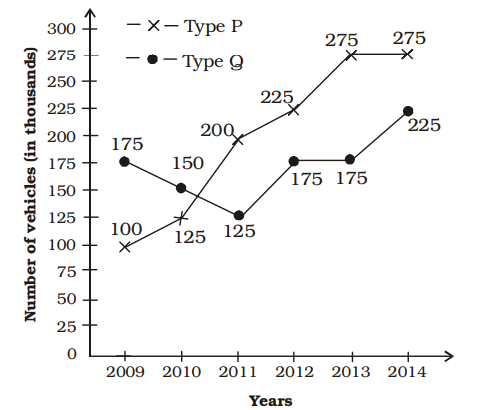
The production of Type Q vehicles in 2010 was approximately what percent of Type P vehicles in 2014?
1080 063a56e408fc9692134069535
63a56e408fc9692134069535 - 160false
- 245.5false
- 354.5true
- 475false
- Show AnswerHide Answer
- Workspace
- SingleChoice
Answer : 3. "54.5 "
Q: In a school of 200 students, the following chart represents the percentage of students involved in different sports.
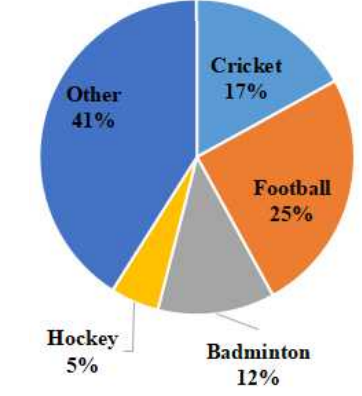
What is the number of students playing cricket?
1080 06446675c5bae6d689245fb33
6446675c5bae6d689245fb33- 117false
- 283true
- 324false
- 434false
- Show AnswerHide Answer
- Workspace
- SingleChoice
Answer : 2. "83 "
Q:Directions: The following pie chart show proportion of population of seven villages in 2009. Stud the pie chart and answer question that follows:
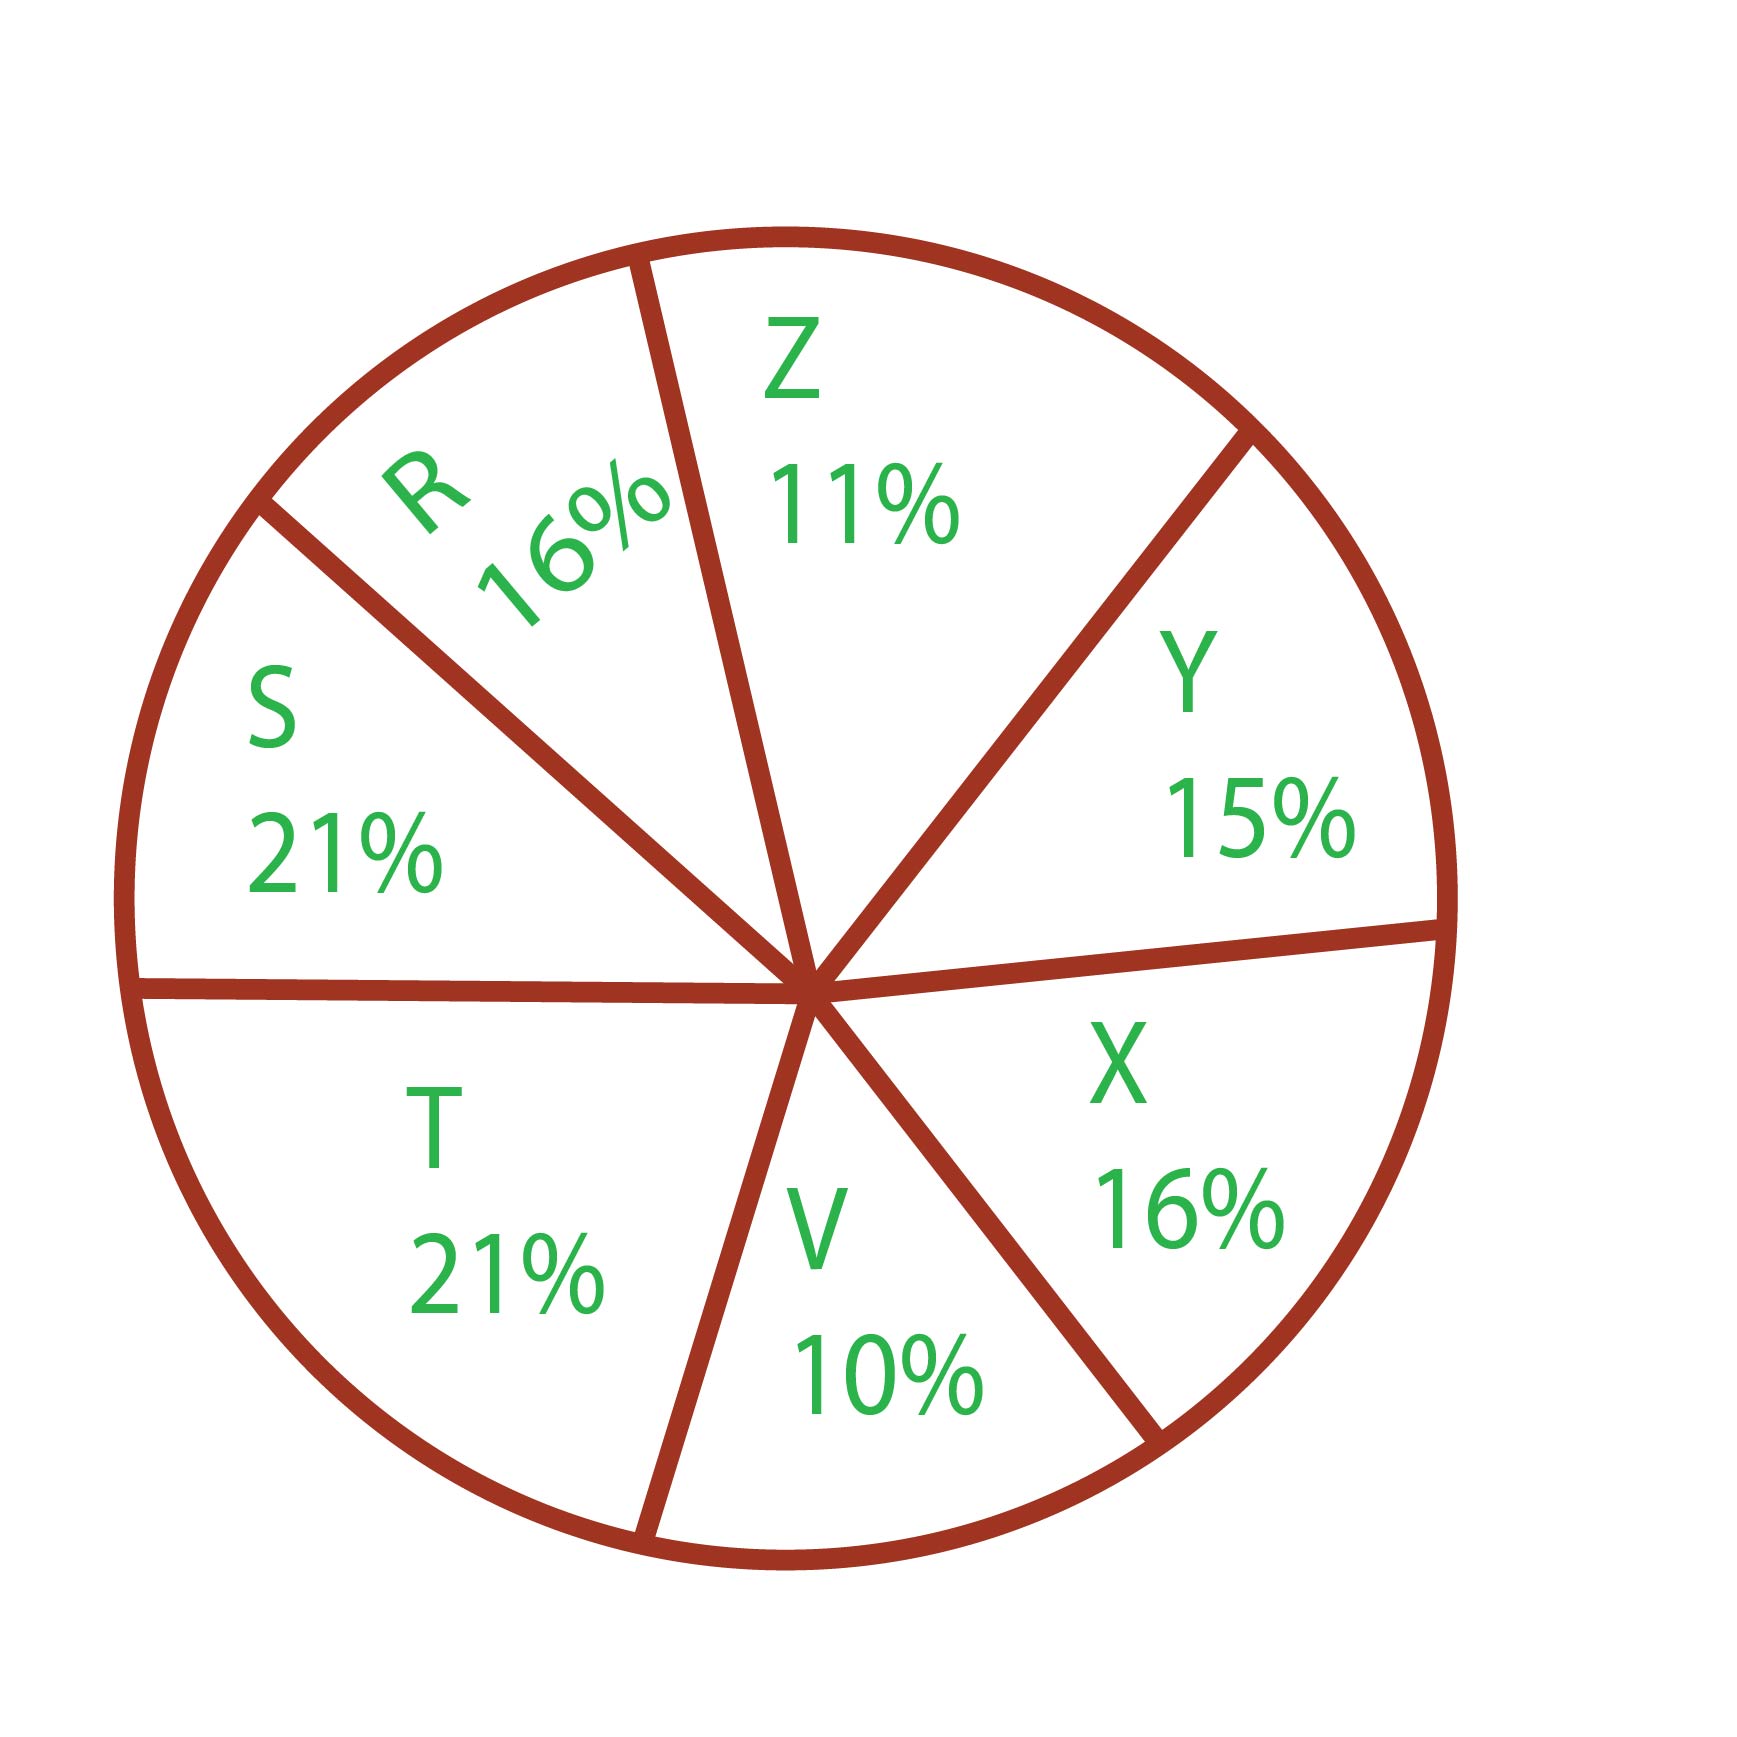
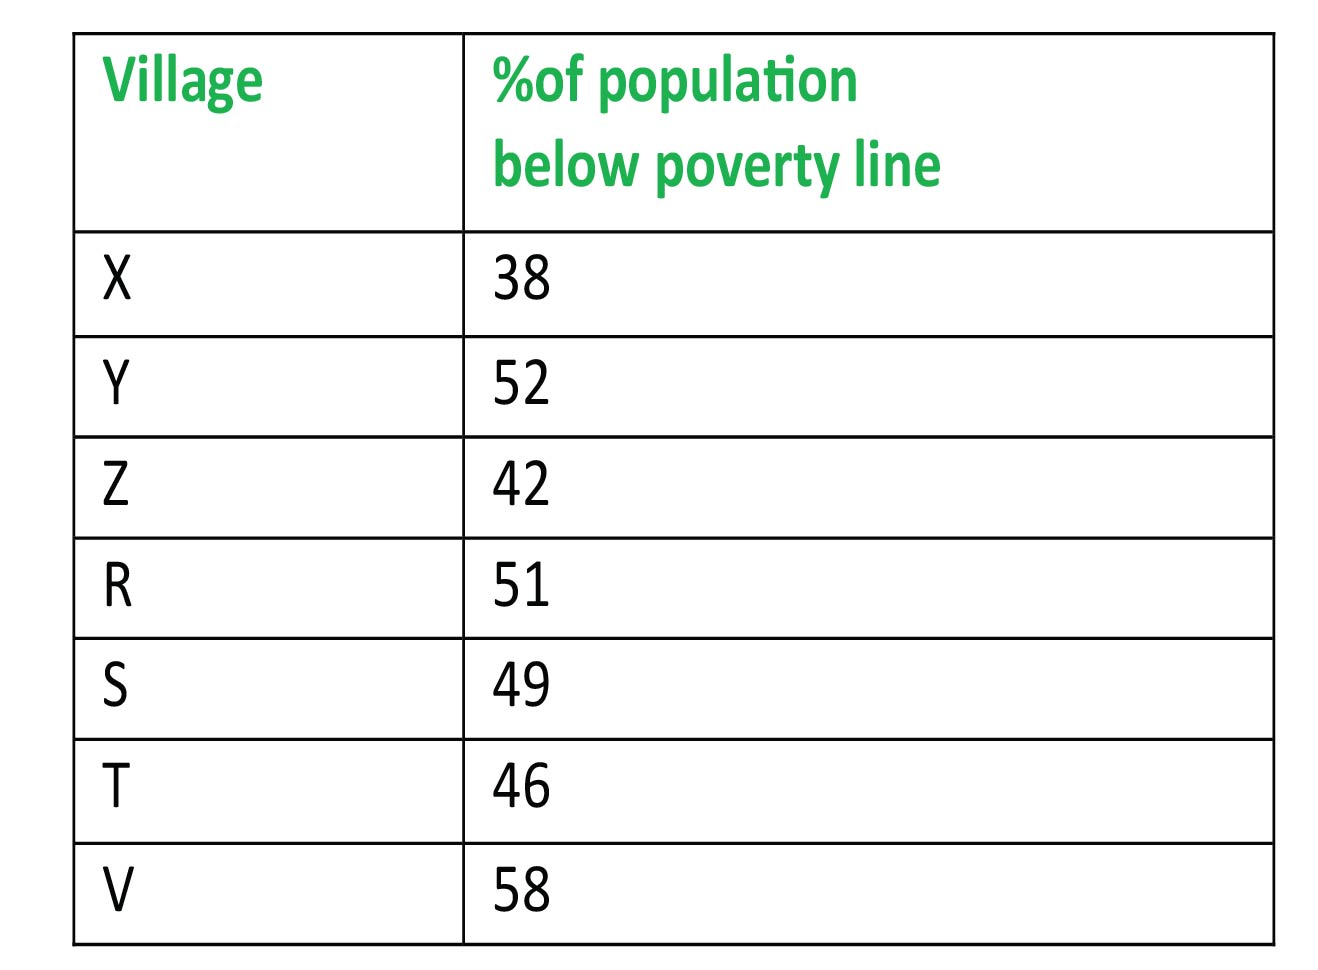
If the below poverty line population of the village 'X' is 12160, then the population of village 'S' is
1076 0640876443218fd8d147bda90
640876443218fd8d147bda90- 118500false
- 220500false
- 322000true
- 420000false
- Show AnswerHide Answer
- Workspace
- SingleChoice
Answer : 3. "22000"
Q:Directions: The pie– chart shows the proposed outlay for different sectors during a Five–Year plan of Government of India. Total outlay is Rs. 40,000 crores. By reading the pie–chart answer the following three questions.
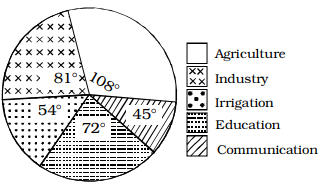
What is the proposed outlay for Education?
1067 06489a3f7b90df94e034c7e06
6489a3f7b90df94e034c7e06- 1Rs. 6000 croresfalse
- 2Rs. 8000 crorestrue
- 3Rs. 9000 croresfalse
- 4Rs. 7000 croresfalse
- Show AnswerHide Answer
- Workspace
- SingleChoice
Answer : 2. "Rs. 8000 crores "
Q:Directions : Study the following bar graph and answer the questions.
company (in lakhs of rupees) for the years 1994-1997:
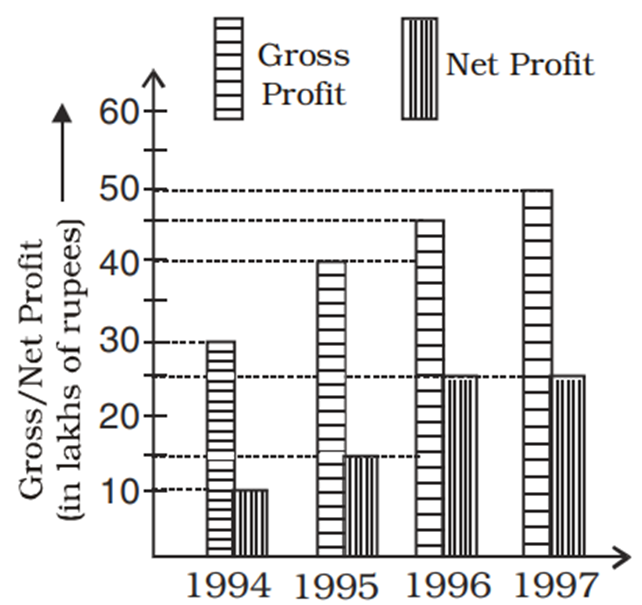
The percentage of net profit of 1995 as compared to the gross profit in that year is
1066 06460f549c899b466f4458b03
6460f549c899b466f4458b03- 125.5%false
- 235.5%false
- 337.5%true
- 442.5%false
- Show AnswerHide Answer
- Workspace
- SingleChoice